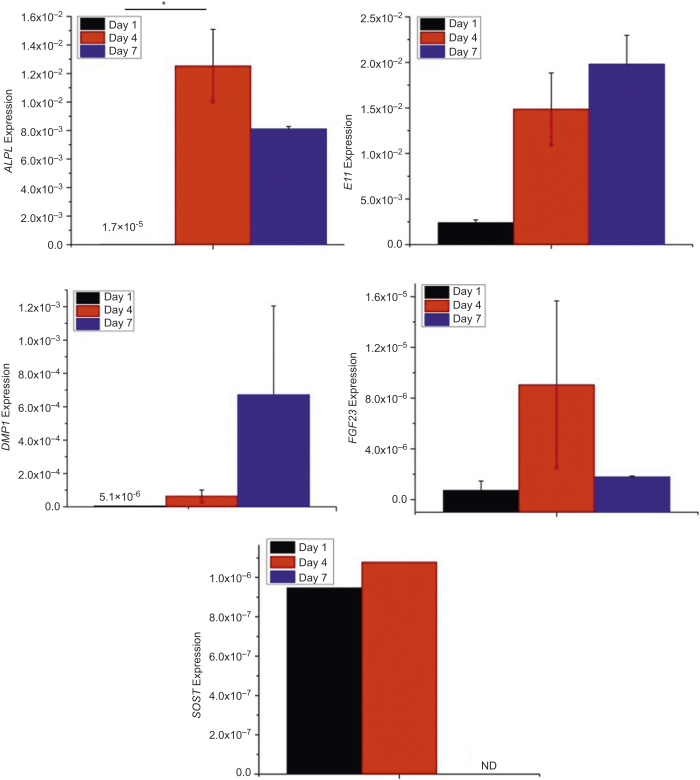
Figure 5.
ALPL, E11, DMP1, FGF23, and SOST gene expressions of outgrown cells during 2D culture. *P < 0.05. The data presented are the result from cell isolation with four mice. Cells were cultured in duplicate culture wells. Each bar graph is the average of the two samples. SOST expression was only detected in one of the two wells at Days 1 and 4.

