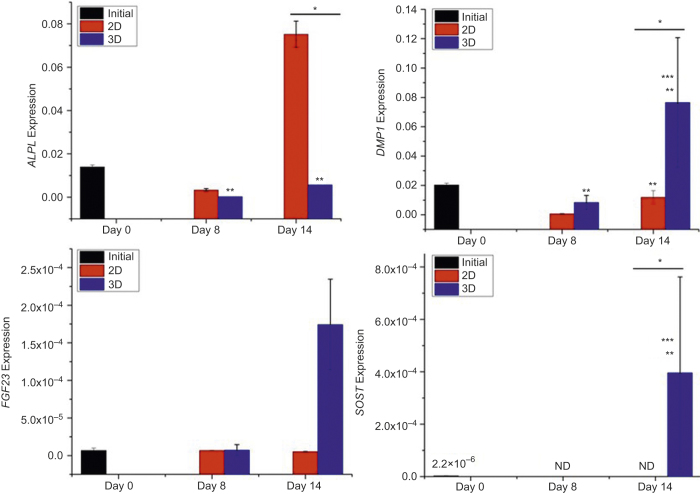
Figure 8.
Osteocytic and osteoblastic gene expressions of 3D- and 2D-cultured outgrown cells. The data presented are the result from cell isolation with four mice. Cells were cultured in duplicate culture wells. Each bar graph is the average of the two samples. *Significant difference between 2D and 3D. **Significant difference compared to Day 0. ***Significant difference compared to previous time point. P < 0.05.

