Figure 3.
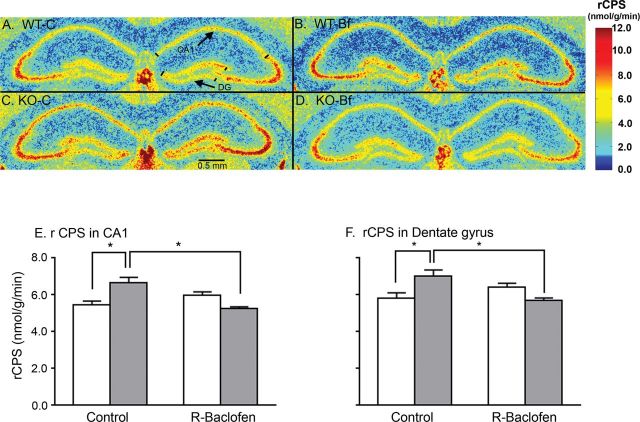
Effect of R-baclofen treatment on rates of cerebral protein synthesis (rCPS) in the dorsal hippocampus. Representative digitized autoradiographic images color-coded for rCPS at the level of the dorsal hippocampus in (A) WT-C, (B) WT-Bf, (C) KO-C, and (D) KO-Bf mice. The color scale in the color bar at the right and the scale bar (0.5mm) in C apply to all four images. In A, the arrows identify the Cornu Ammonis Area 1 (CA1) pyramidal cell layer and the granular layer of the dentate gyrus. Mean ± standard error of the mean rCPS for each group is given for (E) the CA1 pyramidal cell layer and (F) the granular layer of the dentate gyrus. The genotype x treatment x region interaction was statistically significant (Table 2), so we tested for differences between vehicle and R-baclofen treatment in each genotype and for a genotype difference in the vehicle-treated animals by means of post hoc t-tests; *p < 0.01. KO-Bf, knockout R-baclofen group; KO-C, knockout control group; WT-Bf, wildtype R-baclofen group; WT-C, wildtype control group.

