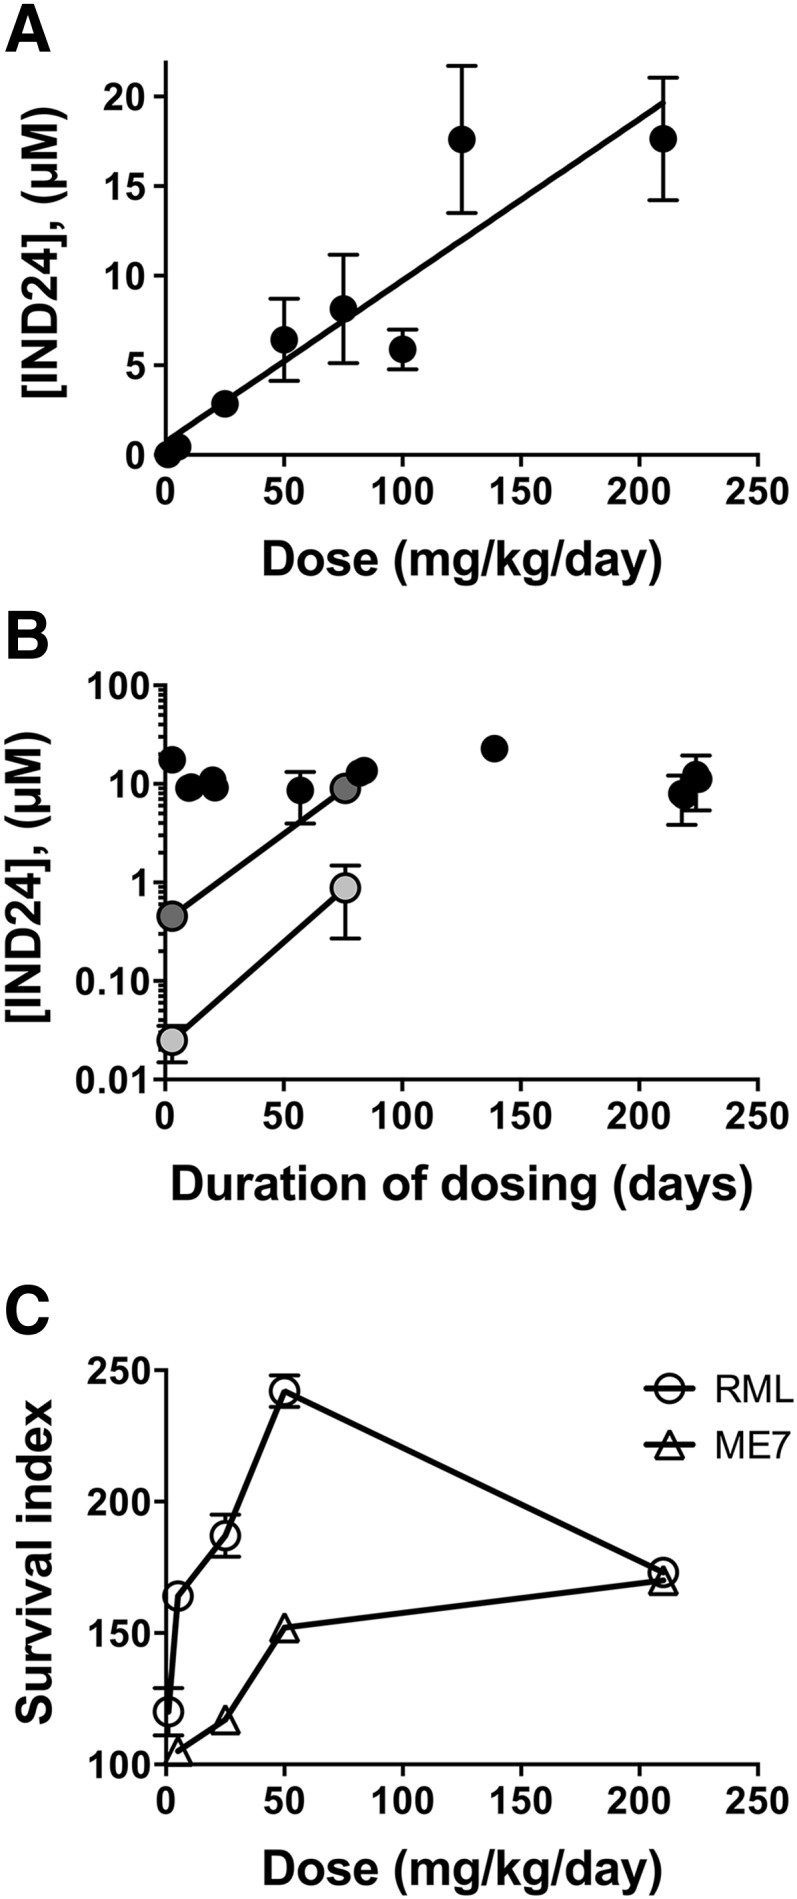
Fig. 2.

Relationship of IND24 dose to brain concentration and survival. (A) Brain concentration of IND24 was determined from groups of three mice fed a complete liquid diet containing various amounts of IND24 for 3 days; each point represents up to 23 independent replicates. A strong direct correlation (R2 = 0.84) was observed between the amount administered and that reaching the brain. Error bars represent S.D. (B) Brain levels of IND24 with long-term dosing at 210 mg/kg per day (black), 5 mg/kg per day (gray), and 1 mg/kg per day (light gray). Marked dose accumulation was observed at 1 and 5 mg/kg per day. Error bars represent S.D. (C) The relationship between dose and survival was not linear for wt mice inoculated with RML (circles) or ME7 (triangles) prions. Error bars represent S.E.M.
