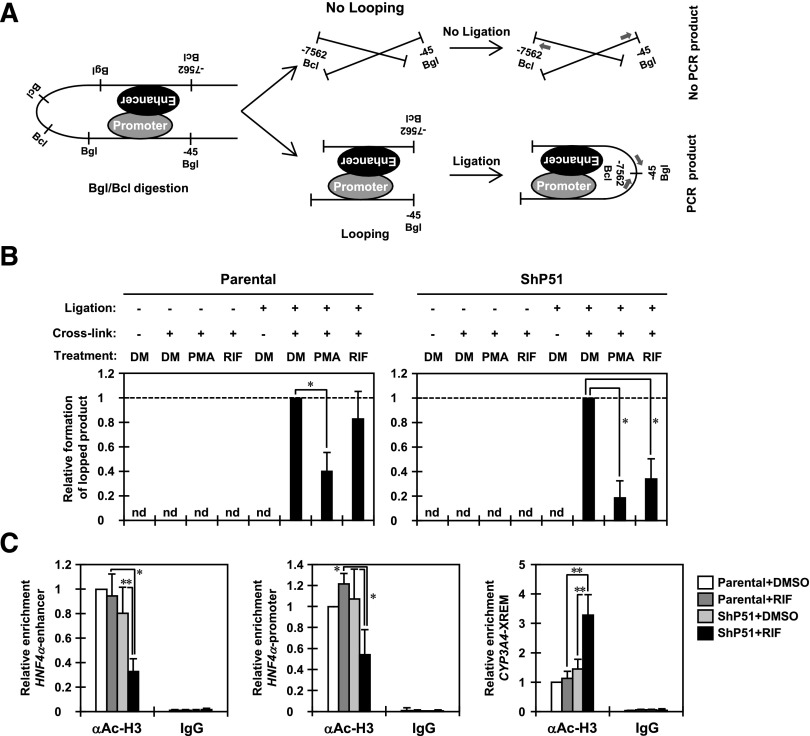
Fig. 2.
PXR disrupts a long-range interaction between the distal enhancer and proximal promoter regions of the HNF4α P1 promoter. (A) A schematic representation of the 3C assay for the P1 promoter of the HNF4α gene. Numbers indicate positions relative to the transcription starting site; arrows indicate the positions of the PCR primers. (B) Eight hours after treatment with DMSO or RIF, parental HepG2 and ShP51 cells were cross-linked by CH2O treatment, and then nuclei were prepared and subjected to 3C assays as described in Materials and Methods. From purified DNAs, formation of the 3C ligated fragment was detected by PCR amplification using TP1 and TP2 primers. A control fragment was also amplified using CP1 and CP2 primers to verify the quantity and quality of the DNA. The intensity of PCR amplification was quantified by densitometry, and the values were normalized by amplification of a control product in each sample and are expressed by taking the levels in the cells with DMSO treatment as one. Columns represent the mean ± S.D. from at least three independent experiments. *P < 0.05 (Dunnett’s test). DM, DMSO; nd, not detected. (C) Eight hours after treatment with DMSO or RIF, parental HepG2 and ShP51 cells were cross-linked by CH2O treatment and subjected to ChIP assays with normal IgG or anti–acetyl-histone H3 (K9/K14) antibody as described in Materials and Methods. The relative enrichment of the distal enhancer and proximal promoter regions of the HNF4α P1 promoter in the immunoprecipitated DNA fragments with anti–acetyl-histone H3 antibody was determined by real-time PCR. The XREM of the CYP3A4 promoter was also analyzed as a gene that PXR upregulates. Values are normalized by amplification of sample inputs and expressed by taking the values in the DMSO-treated parental HepG2 cells as one. Columns represent the mean ± S.D. from three independent experiments. *P < 0.05 (Tukey-Kramer’s test); **P < 0.01 (Tukey-Kramer’s test).

