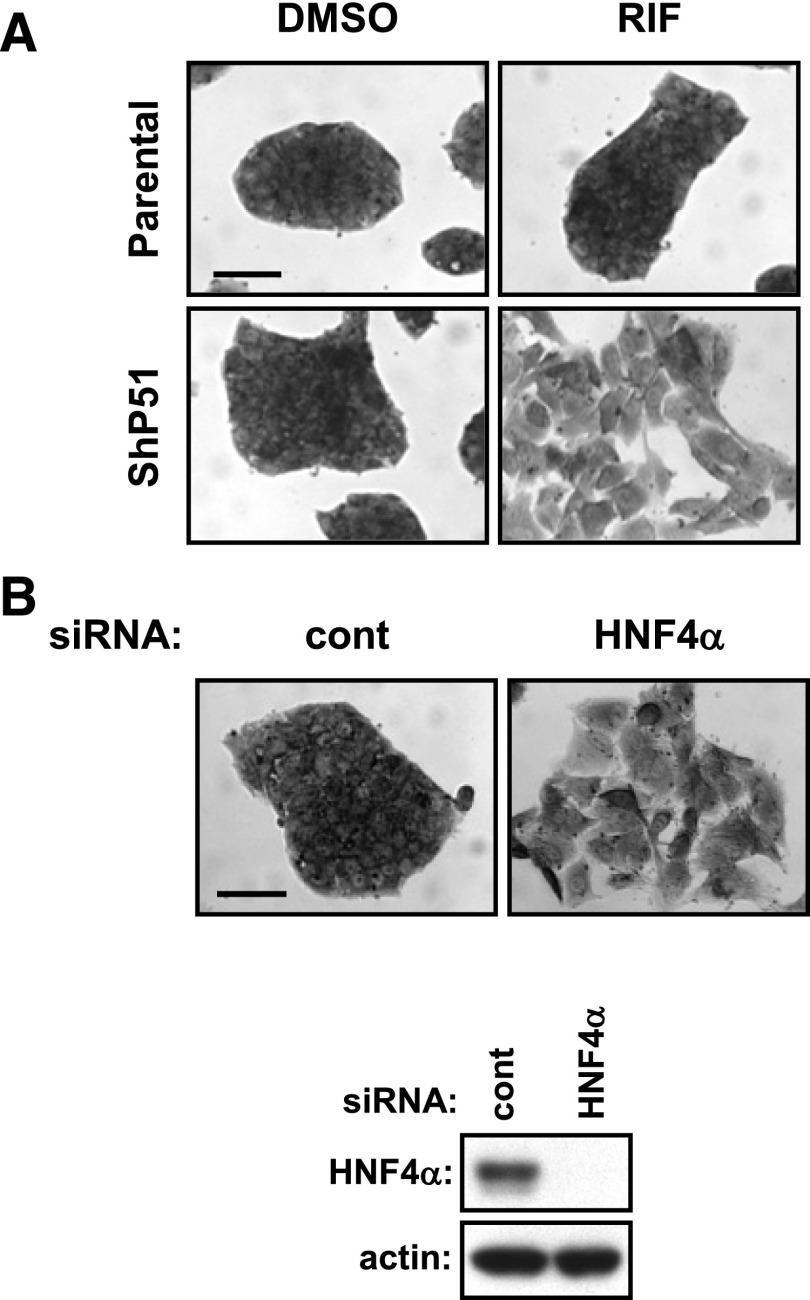
Fig. 5.
Loss of HNF4α induces morphological changes in HepG2 cells. (A) Parental HepG2 and ShP51 cells were treated with DMSO or RIF for 48 hours in FBS-free MEM and then stained with a crystal violet solution as described in Materials and Methods. Scale bar, 100 μm. One representative out of three independent experiments is shown. (B) Parental HepG2 cells were reverse-transfected with control or HNF4α siRNAs for 30 hours, treated with RIF or DMSO for another 48 hours in FBS-free MEM, and stained with a crystal violet solution. Scale bar, 100 μm. Whole cell extracts were also prepared and subjected to western blotting using anti-HNF4α or anti-actin antibodies. One representative out of three independent experiments is shown. cont, control.

