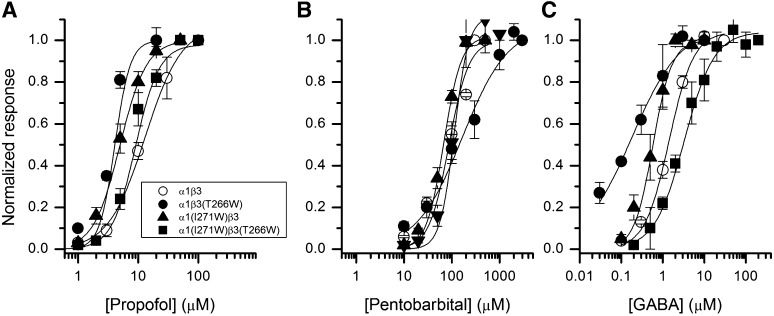
Fig. 5.
Concentration-response properties of human α1β3 receptors. The figure shows propofol (A), pentobarbital (B), and GABA (C) concentration–response curves for wild-type and mutant receptors. The data points show normalized responses (mean ± S.E.M.) from at least four cells at each condition. Current responses were normalized to the response to the highest concentration of agonist used in analysis. The curves show predictions of eq. 1 generated with the overall mean EC50 values from Table 3. In cases where no clear saturation was observed but higher drug concentrations produced block, Ymax was constrained to the value of the highest current response. In A, the maximal fitted response and nH were 1.07 ± 0.01 and 1.7 ± 0.3 (α1β3), 1.0 (constrained) and 4.3 ± 0.7 [α1β3(T266W)], 1 and 2.0 ± 0.1 [α1(I271W)β3], and 0.98 ± 0.02 and 2.9 ± 0.4 [α1(I271W)β3(T266W)]. In (B), the maximal fitted response and nH were 1 and 2.1 ± 0.3 (α1β3), 1.07 ± 0.03 and 0.9 ± 0.06 [α1β3(T266W)], 1.02 ± 0.01 and 2.4 ± 0.1 [α1(I271W)β3], and 1 and 2.9 ± 0.6 [α1(I271W)β3(T266W)]. In (C), the maximal fitted response and nH were 1.04 ± 0.01 and 1.5 ± 0.1 (α1β3), 1.07 ± 0.06 and 0.8 ± 0.1 [α1β3(T266W)], 1.0 and 2.0 ± 0.1 [α1(I271W)β3], and 1.04 ± 0.03 and 1.3 ± 0.2 [α1(I271W)β3(T266W)].

