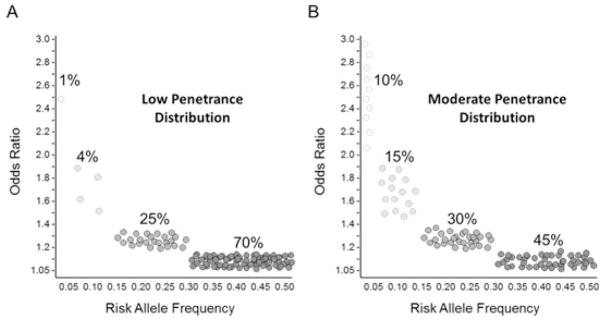
Figure 1.

Hypothetical distributions of risk SNPs for radiotherapy late effects. A) low penetrance distribution, and B) moderate penetrance distribution. In both distributions, SNPs are selected in the given proportions from bins defined as follows: OR 1.05–1.2 and RAF 0.3–0.5, OR 1.2–1.4 and RAF 0.15–0.3, OR 1.4–2.0 and RAF 0.05–0.15, and OR 2.0–3.0 and RAF 0.01–0.05. OR, odds ratio; RAF, risk allele frequency.
