
Figure 3.
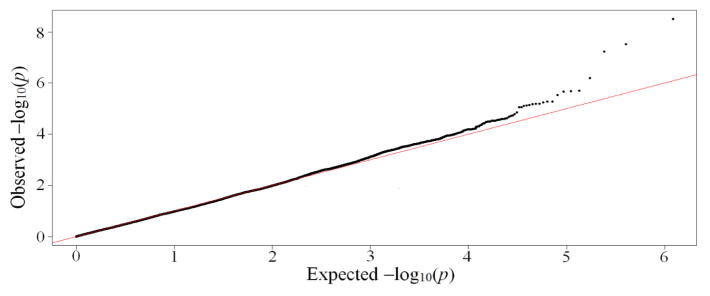
Quantile-Quantile (Q-Q) plot for all SNPs. The diagonal straight line indicates the distribution under the null hypothesis that there is no association between any of the SNPs and rectal bleeding. Strong deviation from the straight line indicates the significant association of SNPs with rectal bleeding.