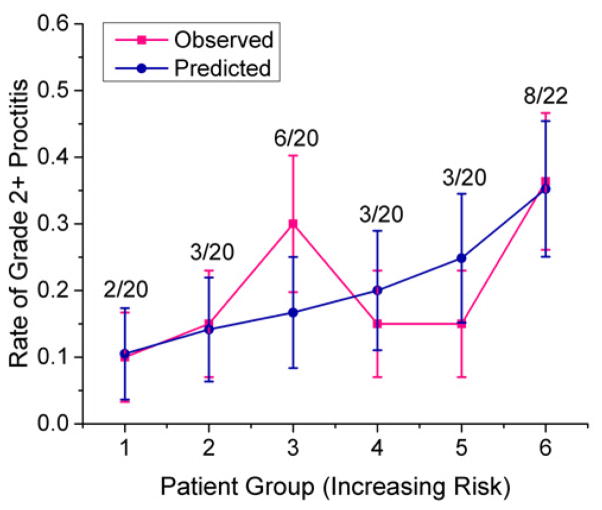
Figure 4.
Comparison between the predicted incidence of grade 2+ rectal bleeding and the actual incidence of grade 2+ rectal bleeding. The predicted outcomes were produced after applying the logistic regression to outputs of the LASSO model using two principal components on the validation dataset with 484 SNPs that entered the LASSO. Based on the sorted predicted outcomes, the patients were binned into 6 groups, with 1 being the lowest toxicity group and 6 being the highest. The ratio above each group represents the observed number of patients who experienced grade 2+ rectal bleeding and the total number of patients in the group.

