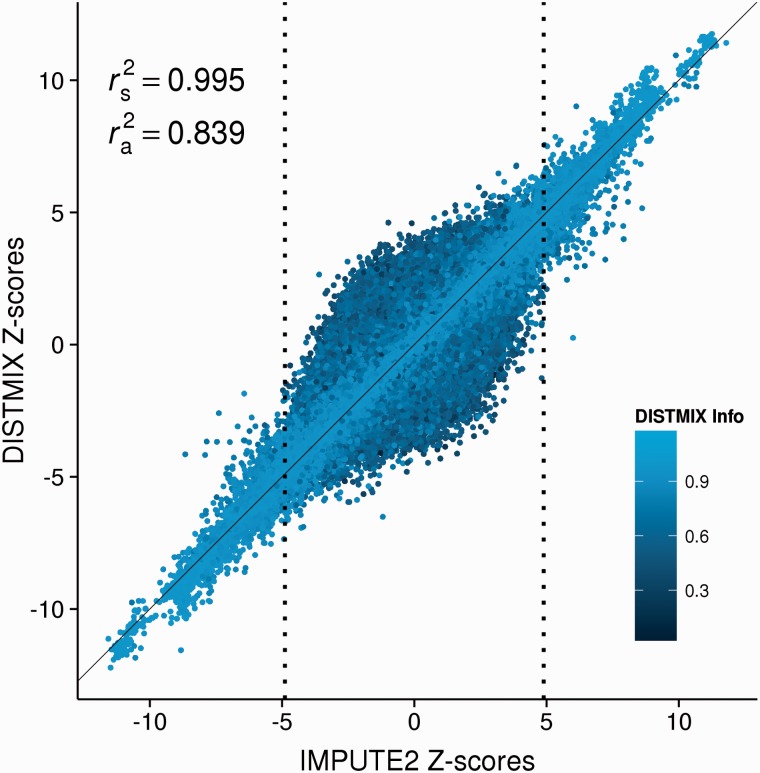
Fig. 2.
DISTMIX Z-scores as a function of IMPUTE2 Z-scores from PGC SCZ2 discovery phase and DISTMIX imputation information. The vertical dotted lines represent the suggestive thresholds for PGC SCZ2 discovery phase (IMPUTE2 P-value < 1 × 10⁻⁶). rs2, the squared correlation coefficient (r2) between DISTMIX and IMPUTE2 Z-scores for the suggestive PGC SCZ2 SNPs; ra2, r2 between two predictions for all SNPs

