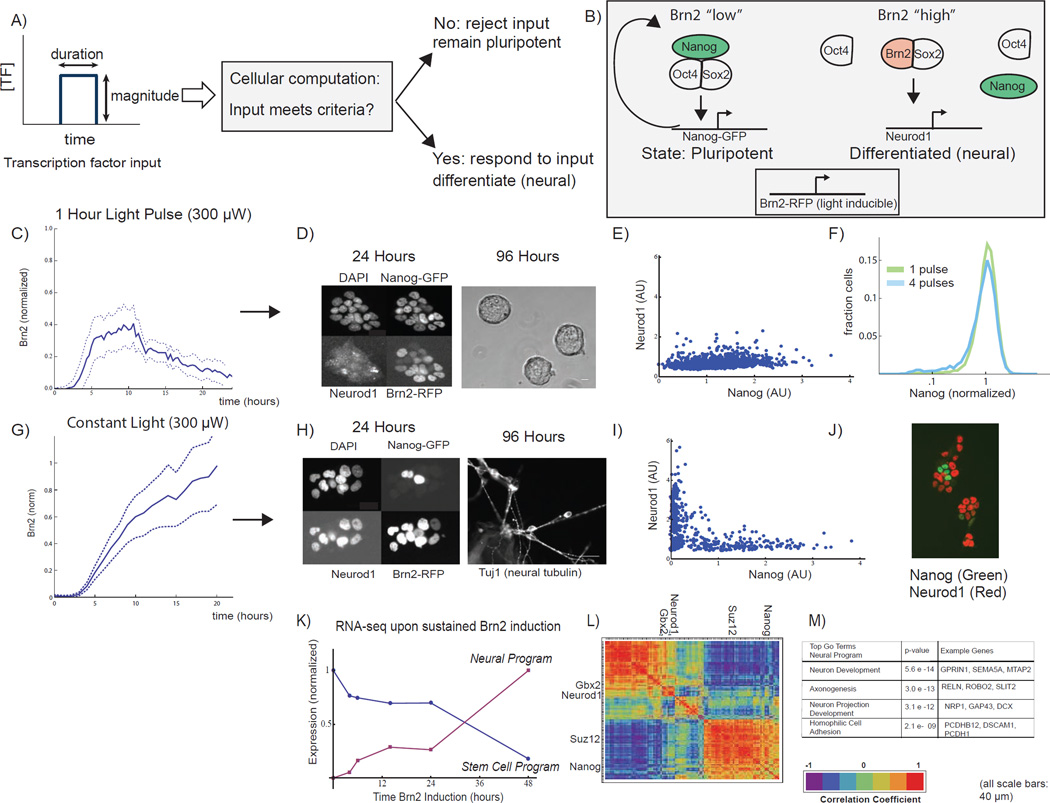
Fig 1. Sustained optical induction of Brn2 drives transition from pluripotency to neural differentiation.
A) In this work, we ask how embryonic stem cells distinguish gene expression fluctuations from development cues. B) The pluripotency network, an auto-regulatory network of transcription factors including Oct4, Sox2, and Nanog, maintains ES cells in a pluripotent state. Neural lineage entry occurs through a competitive binding mechanism where Brn2 binds Sox2, displacing Oct4, to activate neural lineage specific genes including Neurod1. We optically induce Brn2-RFP with the GAVPO system and tag both genomic copies of Nanog with GFP. C) Cells exposed to 1-hour light pulse activate Brn2 but do not differentiate. Brn2-RFP time-course (mean +/− standard deviation of 10 single-cell traces, normalized to constant light maximum, Fig 1G, see also Fig S1E) following a 1-hour blue light pulse (300uW). D) Left: Images of cells 24 hours after 1-hour light pulse, showing DAPI, Nanog-GFP, Neurod1 (IF), and Brn2-RFP. Right: Phase contrast image of ES cell colonies 96 hours after 1-hour light pulse. Cells retain the characteristic ESC circular colony morphology. Scale bars 40um. E) Neurod1 (IF) and Nanog-GFP for >1000 single cells 24 hours following the 1-hour light pulse. F) Nanog-GFP expression following a single 1-hour light pulse (green) or a series of four 1-hour light pulses spaced by 12 hours (blue) (n>10,000, sampled from two biological replicates). G) Sustained activation of Brn2 drives neural differentiation. Brn2-RFP intensity during sustained light exposure (mean +/− standard deviation of 20 cell traces, normalized to max) H) Left: Dapi, Nanog-GFP, Neurod1 (IF), and Brn2-RFP in cells exposed to 24 hours of constant light. Nanog and Brn2/Neurod1 are mutually exclusive. Scale bars 40um. Right: Tuj1 (neuron marker) staining of cells following 96 hours of sustained light exposure. Scale bar 40um. I) Nanog-GFP and Neurod1 (IF) in n >1000 single cells following 24 hours of Brn2 induction. J) Nanog-GFP and Neurod1 images from experiments in I. K) Normalized expression for gene expression programs derived from RNA-seq time course (6 time points, constant light input). L) The hierarchically clustered correlation matrix for 300 sampled genes following Brn2 induction, showing the two programs from Figure 1K as well as key ES (Nanog, Suz12) and neural (Neurod1,Gbx2) genes. M) The neural program’s most statistically significant GO terms and sample genes (see also SI Fig 1,2).

