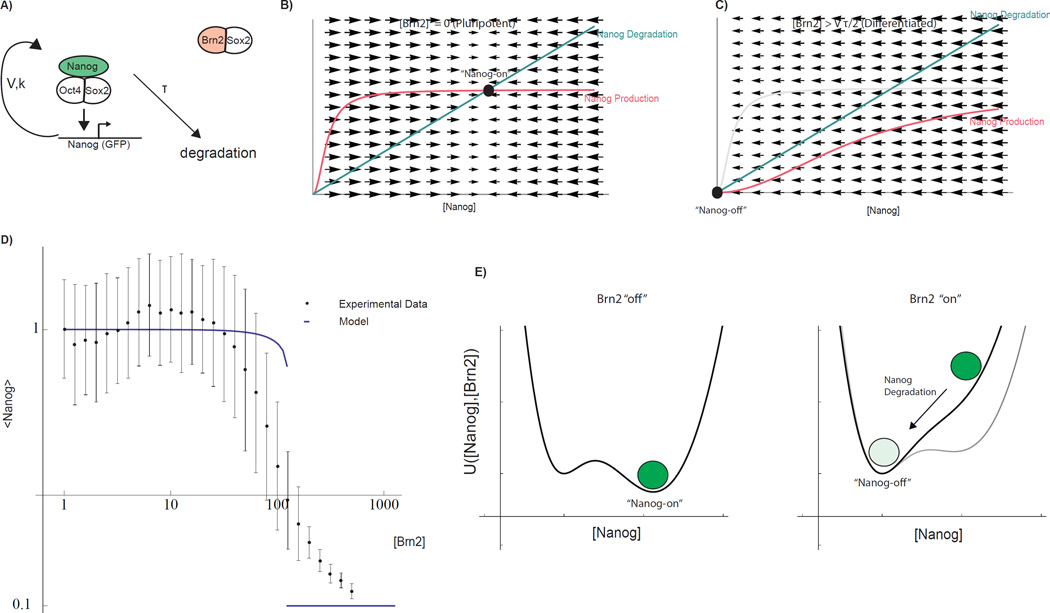
Fig 3. Mathematical model of pluripotency network and Brn2-induced cell fate switch.
A) Topology of the coarse-grained mathematical model. Pluripotency complex is engaged in an auto-regulatory positive feedback loop. Components are subject to first-order degradation. Through competitive binding, Brn2 interferes with the core auto-regulatory loop. Parameters V, K, and τ (Equation 1) parameterize Nanog promoter strength, promoter threshold, and Nanog life-time. B) Geometric analysis of steady states demonstrating the mechanism by which Brn2 can induce a switch-like transition from a Nanog-on to Nanog-off state (see SI for mathematical details). Curves indicate Nanog production (which depends upon [Nanog] due to auto-regulation) and degradation rates as a function of Nanog concentration. Black disk: stable Nanog-on steady state. C) Competitive binding effectively increases the threshold for Nanog promoter activation, sliding to the right the sigmoidal curve representing the Nanog production rate. At a threshold of [Brn2], the Nanog-on state becomes destabilized (intersection point vanishes) and the system collapses towards a Nanog-off state due to Nanog degradation. D) Steady-state Nanog as a function of Brn2 from experiments (mean as well as inter-quartile range) and model fit (thick line) with parameters fit to experimental data. E) Underlying energy landscape U(N,B) for regulatory network derived through direct integration of Eqn 1 and plotted for fixed V, τ, K[B] for a indicated Brn2 levels (Functional form SI, Equation 23). See also SI Fig 4

