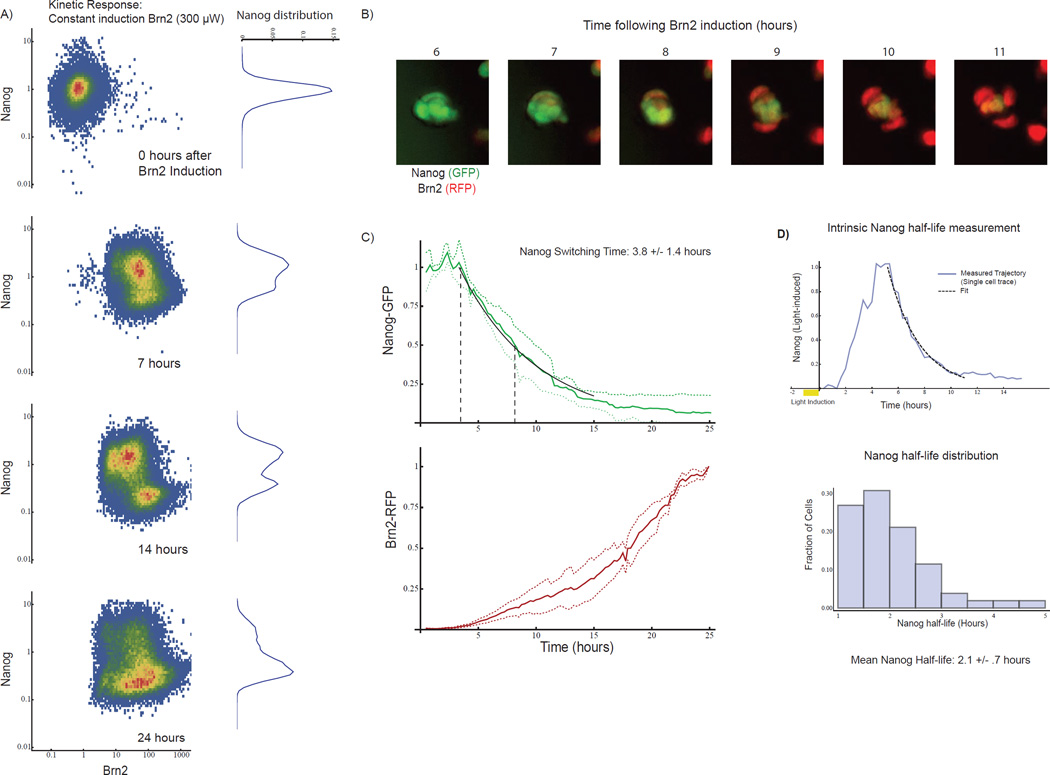
Fig 5. Switch dynamics predict intrinsic Nanog half-life in unperturbed cells.
A) Two-dimensional histograms of Nanog-GFP and Brn2-RFP intensity in ES cell populations as measured by FACS at 0, 7, 14, and 24 hours during constant 300uW light stimulation. Each histogram represents >40,000 single cells. The marginal distribution of Nanog-GFP is shown on the right of each plot. Cells begin transitioning from Nanog-on to Nanog-off state at 7 hours, and by 14 hours the cell population breaks into two subpopulations. B) Nanog-GFP and Brn2-RFP images at one-hour intervals. (20um scale bars) C) Distribution of > 50 single-cell time-courses of Nanog-GFP and Brn2-RFP (mean and standard deviation, normalized to max). From Exponential fit (black line) yielded a switching time of 3.8 +/− 1.4 hours. D) Measurement of Nanog lifetime using optically-inducible Nanog-RFP construct (optical pulse chase). Top: Nanog-RFP dynamics (blue curve) in a light-inducible Nanog cell following a 1-hour light pulse, with exponential fit (black curve). Blue curve is an example single cell trace. Bottom: histogram of Nanog half-life from 50 single-cell time-courses (mean half-life 2.1 +/− .75 hours). See also SI Fig 6

