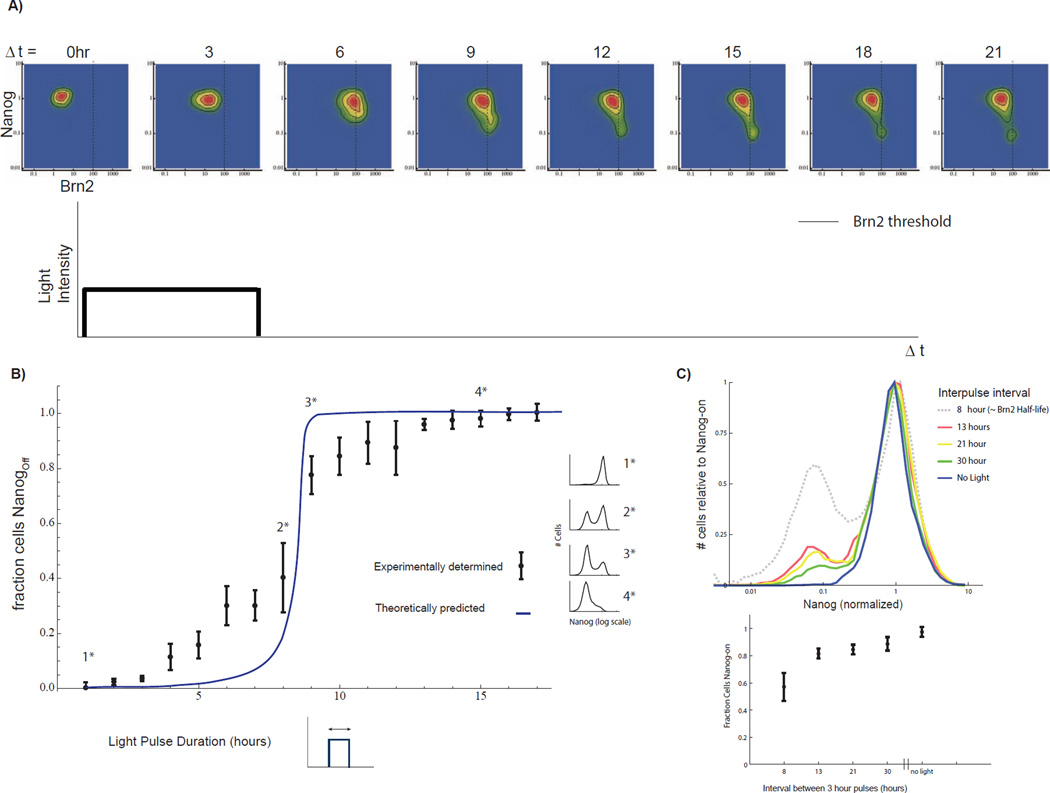
Fig 7. Nanog-half life determines duration filtering properties of the pluripotency network.
A) Brn2 vs. Nanog distribution for >20,000 single cells at each of eight time points. Time is measured in units of hours following light pulse initiation. A dashed line indicates the Brn2 switching threshold (validated by constant input control in SI 10C). The Brn2 level exceeds the threshold in approximately half of the cells at 6 hours following pulse initiation. However, only a fraction of these cells (<20% of the cell sub-population) switch to the Nanog-off state. B) Predictions of model (blue line) and the experimentally-measured Nanog-off fraction (mean and standard deviation) for cells exposed to 300µW light pulses of 0 to 17 hours. For pulses of less than 5 hours >80% of cells maintain Nanog in the on state. Half of the cell population switches for a 8.5-hour light pulse. Example Nanog distributions shown in the margin. C) Top: Histograms of Nanog-GFP following repeated 3-hour light pulses with variable inter-pulse spacing as indicated. Experiment performed over 48 hours and n>10,000 cells measured for each experiment. Brn2 half-life is approximately 8 hours. Histograms normalized to height of Nanog-on peak for comparative purposes. Total number of pulses delivered is: 3 pulses, 13 hour interval; 2 pulses 21 hour interval; 1.5 30 hour interval). Bottom: fraction of Nanog-on cells, mean +/− standard deviation for three biological replicates. See also SI Fig 7

