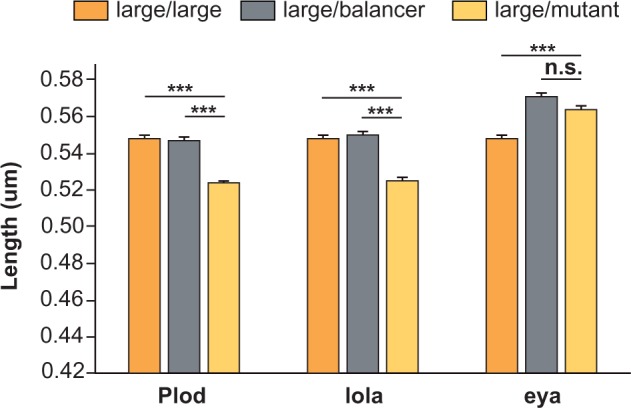
Fig. 7.

Genetic crosses show candidate genes affect egg size. Comparison of egg length from parental isogenic lines derived from large population cages (dark yellow) to those from F1 females carrying one copy of balancer (gray) or one copy of mutant chromosome of the indicated genes (light yellow). No detectable difference in egg length was observed between isogenic lines (dark yellow) and heterozygote females carrying balancer (gray). However, females carrying chromosomes with the mutant alleles of Plod and lola (light yellow) produced significantly shorter eggs. Y axis indicates mean length ± SEM. ***P < 0.0001.
