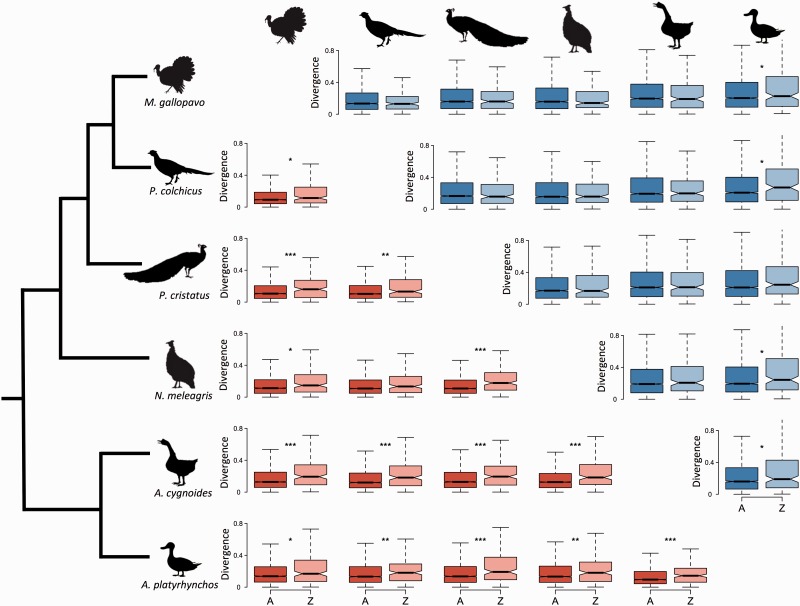
Fig. 3.
Branch-specific pairwise gene expression divergence for female and male gonad. Gene expression divergence in female gonad shown below the diagonal (in red) and male gonad above the diagonal (in blue). Genes on autosomes are shaded darker and genes on Z chromosome shaded lighter. Two-sided Wilcoxon tests for significant differences between autosomal and Z chromosome divergence denoted by *P < 0.05, **P < 0.01, ***P < 0.001.

