Fig. 3.

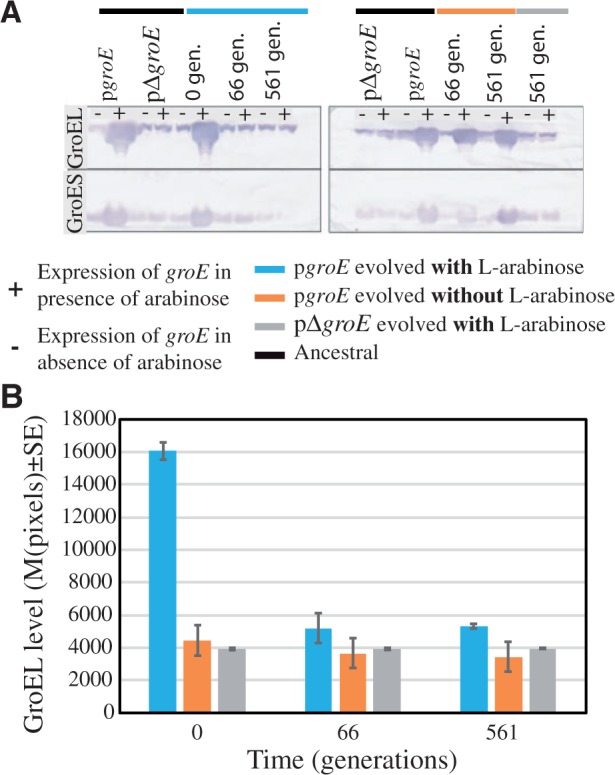
Reduction of GroEL levels in Escherichia coli MG1655 ΔmutS populations evolving under mild genetic drift effects. (A) GroEL detection by quantification of protein dot-blot hybridized with monoclonal GroEL antibody (ABCam #ab905022 at 1:1,000). The left panel corresponds to groE expression in the presence of l-arabinose (pgroE) and its control pΔgroE at the start of the evolution experiment (0 generations), 10 passages (66 generations), and 85 passages (561 generations). The right panel corresponds to the same experiment as in the left panel but without the presence of the inducer l-arabinose (groE). (B) Expression of groE quantified using the mean pixels ± SE from the Western blots in (A) at different time points expressed as generations. The different lines examined were labeled in blue (pgroE growing in the presence of l-arabinose), orange (pgroE growing in the absence of l-arabinose), and gray (pΔgroE).
