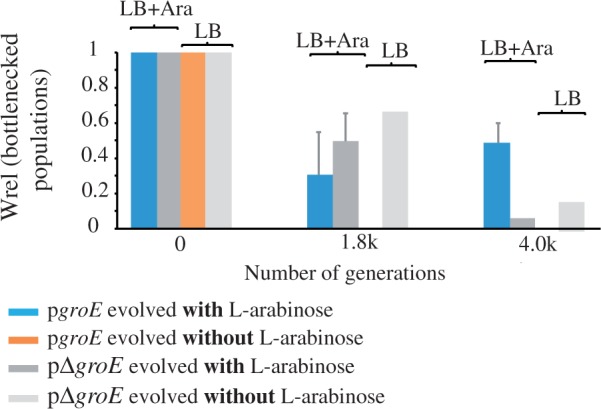
Fig. 5.

Relative fitness of bottlenecked populations. Average relative fitness (Wrel ± SE) of the evolved bottlenecked lines measured at 0, 1,870 (1.8K), and 3,960 (4K) generations of their evolution. Wrel data were obtained by head-to-head competitions of the evolved lines against their ancestors. Populations were grown for the Wrel quantification in the same kind of media used for their evolution, LB supplemented with the inducer arabinose and LB media without the inducer. Blue bars correspond to pgroE lines evolved with l-arabinose, dark gray to pΔgroE lines evolved with l-arabinose, light gray to pΔgroE lines evolved without l-arabinose, and orange to pgroE evolved without l-arabinose. Data to build this graph are presented in supplementary table S1, Supplementary Material online.
