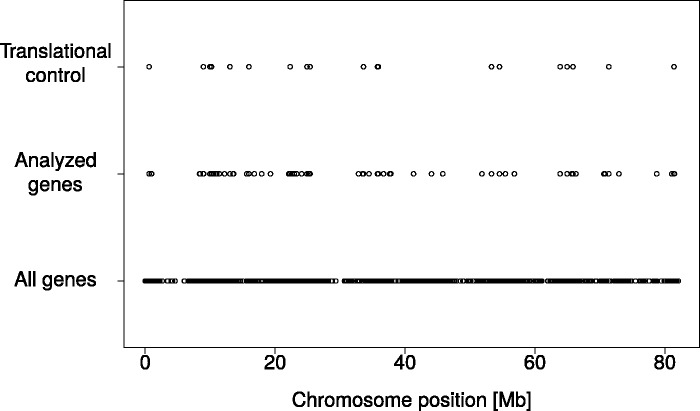
Fig. 4.
Distribution of genes along the chicken Z-chromosome. The figure shows the location of all ENSEMBL annotated genes (bottom), genes analyzed in this study for which both proteomic and RNA-seq data were available (middle) and genes that showed a consistent difference in the M:F expression ratio between RNA and protein levels.

