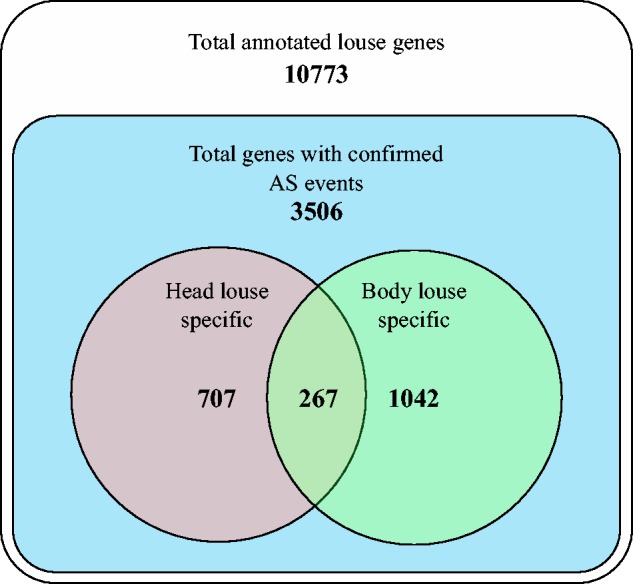
Fig. 3.

Diagram of alternatively spliced gene counts in head and body lice. The most outer square shows the total number of annotated louse genes. The inner square represents those genes with at least one confirmed AS event in either head or body lice. The left circle includes genes with at least one AS event unique to the head louse. The right set includes genes with at least one AS event unique in the body louse. The intersection includes genes with both at least one unique AS event in head lice and one unique AS event in body lice.
