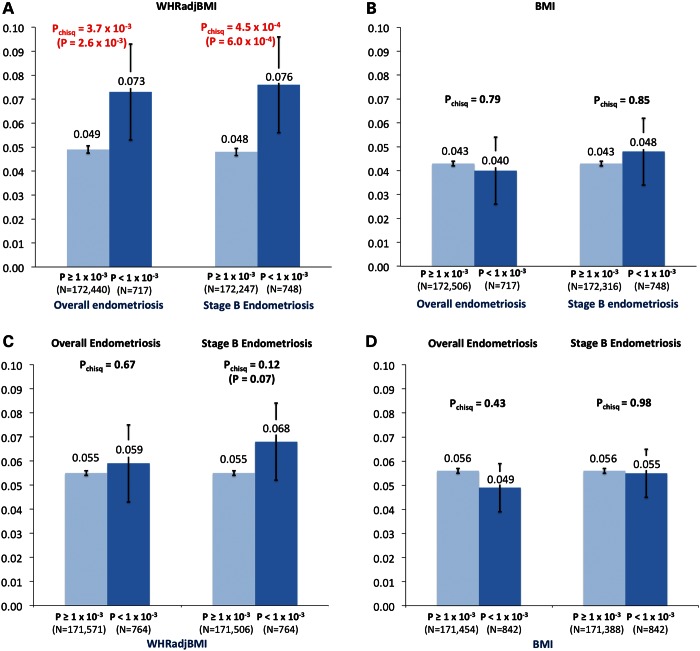
Figure 1.
Genetic enrichment analyses between endometriosis, BMI and WHRadjBMI GWAS datasets, using independent (r2 < 0.2) SNPs. The panels show (i) The proportion of SNPs nominally associated (P < 0.05) with WHRadjBMI (A) or BMI (B) by significance of overall and Stage B endometriosis association (P < 1.0 × 10⁻³ versus P ≥ 1 × 10⁻³); (ii) The proportion of SNPs nominally associated (P < 0.05) with overall and Stage B endometriosis by significance of WHRadjBMI (C) and BMI (D) association (P < 1.0 × 10⁻³ versus P ≥ 1 × 10⁻³). P-values of χ2 tests assessing statistical difference between proportions are shown above each set of bars, and 95% confidence intervals of the proportions are given on each bar. For differences with Pchisq < 0.2, empirical P-values are given in brackets (see Supplementary Material, Methods).

