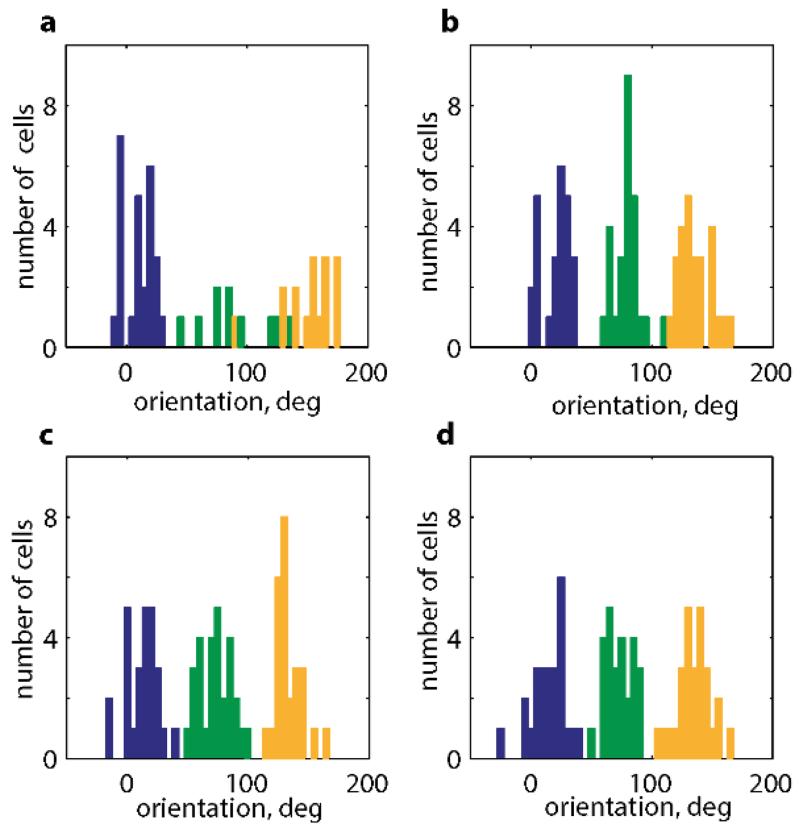
Extended Data Figure6. Distribution of grid components on the left and right sides of trapezoidal and square enclosures.
The distribution of the individual grid cell components on the left (a) and right (b) sides of the trapezoid and square (left(c) and right (d)). Components 1, 2 and 3 are shown in blue, green and orange respectively. Data from 8 rats, 10 grid modules, 26 grid cells. Note the similarity of all 4 blue components and of the green and orange components on both sides of the square and on the right side of the trapezoid.

