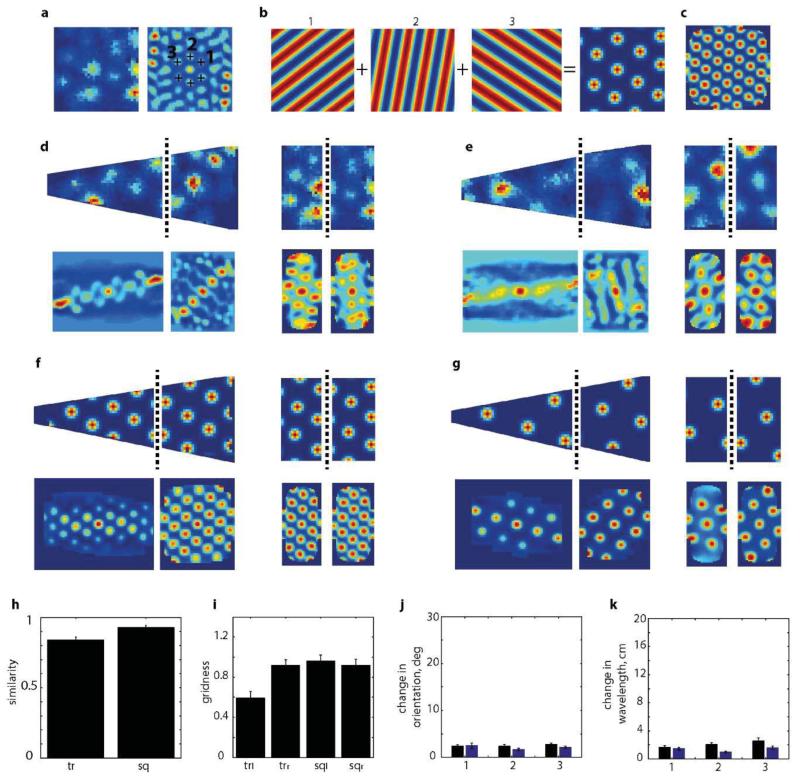
Extended Data Figure7. Simulated grid cells.
a, Grid cells were simulated using the orientations and wavelengths of the three main grid components (1, 2, 3) taken from the spatial autocorrelogram (a, right) of a real grid cell (a, left) as shown in this typical example. b, Simulated grid pattern was generated by summing three grid components to retrieve the rate map and spatial autocorrelogram (c) which well approximated the real data shown in (a). f-g, examples of the procedure applied to the two cells in (d) and (e) respectively. Grid cells were generated from the autocorrelogram in the square. h, Correlation coefficient between right and left side of the simulated grid data in trapezoid (left) and square (right). i, Grid scores of simulated grids on left and right side of trapezoids and squares. The lower grid score in the left side of the trapezoid is due to under-sampling. Change in orientation (j) and wavelength (k) of 3 components of simulated grids in trapezoid (black bars) and square (blue bars).

