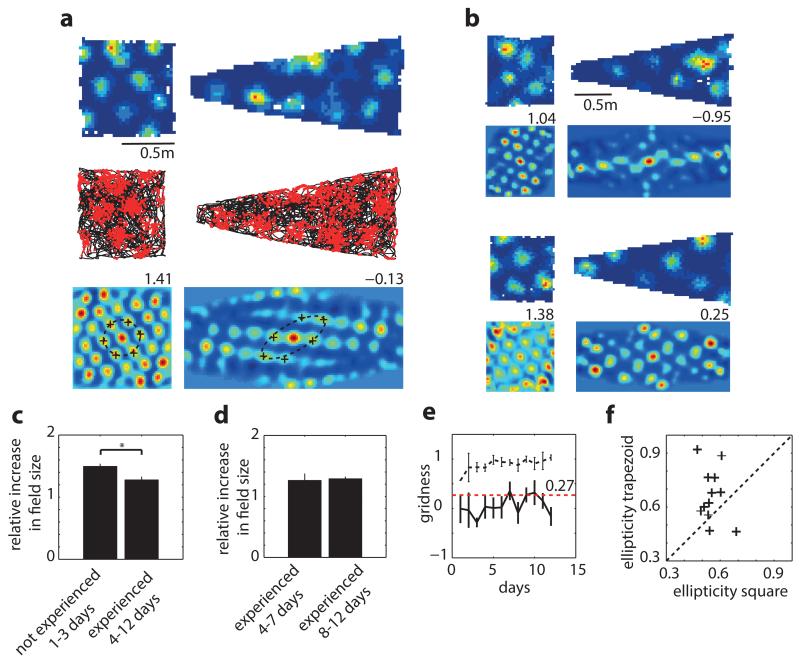
Figure 3. Grid pattern is distorted in trapezoids.
a, Grid-cell rate maps (top), trajectory (black) with spike positions (red, middle), and spatial autocorrelograms (bottom) for two successive trials in square and trapezoid. Gridness on top right of autocorrelogram. Dashed-line, ellipse best approximating grid cell symmetry; ‘+’, main grid components. b, Two more examples as in (a) from two other rats. c, Mean ratio between field size in trapezoid and square. Grid-fields larger on days 1-3 than 4-12 (1.49±0.04 vs. 1.28±0.05 p=0.029, t=2.54, df=10; two-sample t-test) but (d) not significantly different between days 4-7 and 8-12 (p=0.79, t=−0.27, df=7, two-sample t-test). e, Gridness across days in trapezoid (solid-line) and square (dashed-line); red-line, gridness threshold of 0.279. f, Grid-cells are more elliptical in trapezoid than square: mean±s.e.m.: 0.67±0.04 (trapezoid) vs. 0.55±0.02 (square), p=0.02, t=−2.5, df=22, two-sample t-test.

