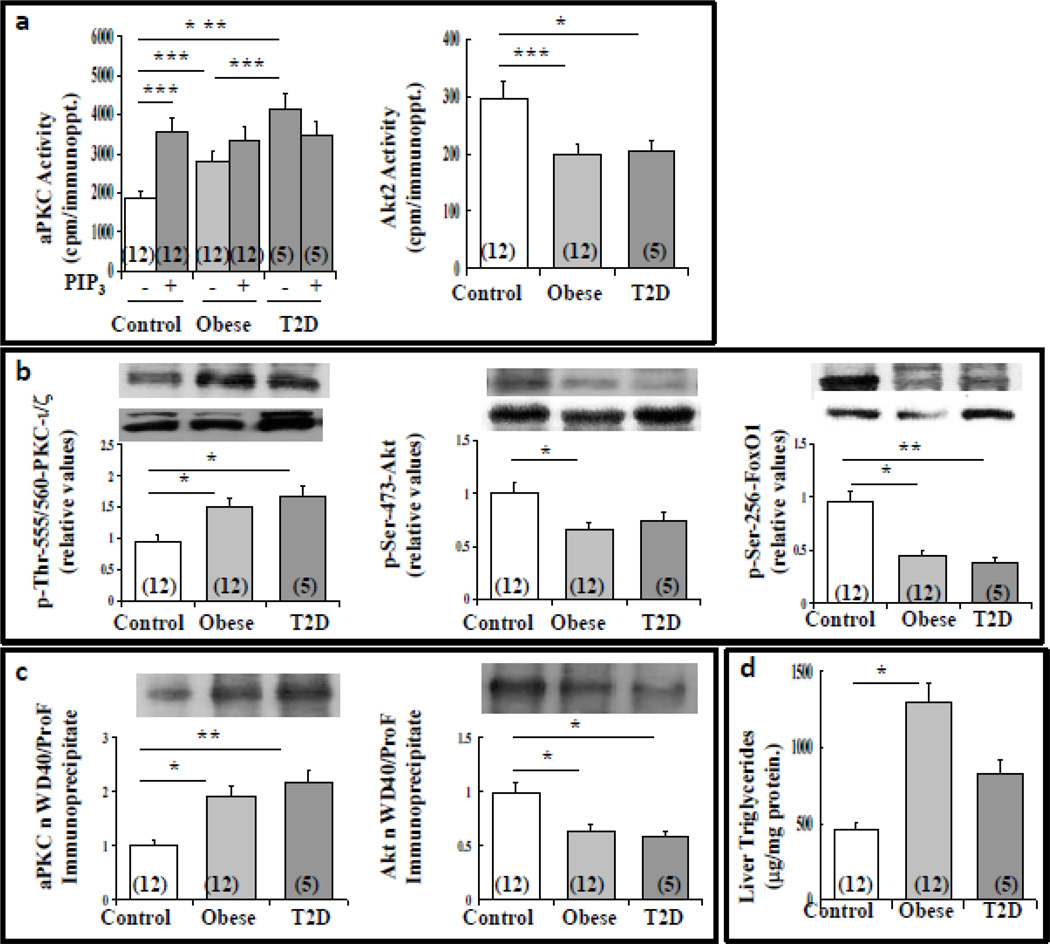
Figure 1.
Alterations in enzyme activity of aPKC and Akt (panel a), phosphorylation of aPKC, Akt and FoxO1 (panel b), association of aPKC and Akt with immunoprecipitable WD40/ProF (panel c) and triglyceride levels (panel d) in livers of lean, obese and T2D humans. Values are mean ± SEM of (N) patients. Asterisks indicate: *, P<0.05; **, P<0.01; and ***, P<0.001 (ANOVA). Representative blots are shown in panels b and c (upper bands, phosphoproteins; lower bands, total proteins).

