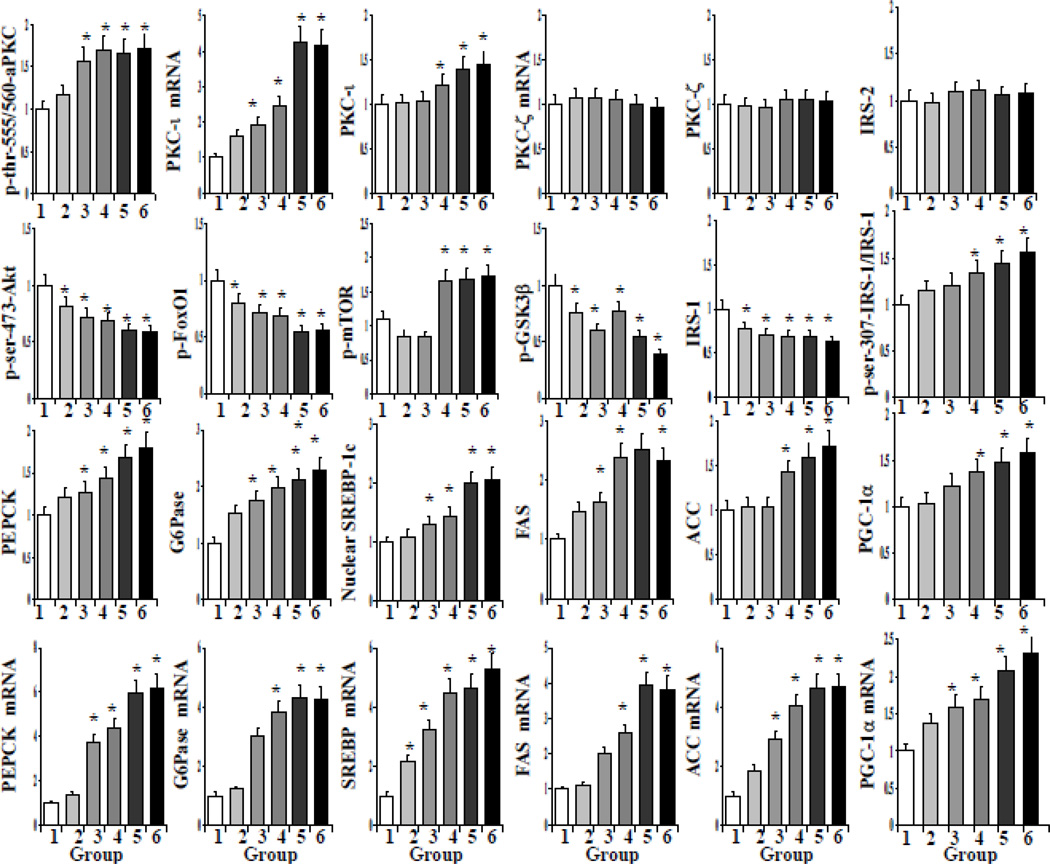
Figure 3.
BMI-related alterations in: (top row), phosphorylation of aPKC and expression and abundance of aPKCs and IRS-2; (2nd row), phosphorylation of Akt, FoxO1, mTOR and GSK3β, and IRS-1 levels; (3rd row), protein levels of gluconeogenic and lipogenic enzymes and PGC-1α; and (4th row) mRNA levels of gluconeogenic and lipogenic enzymes and PGC-1α in livers of lean group-1 [BMI=20-25, N=12], overweight group-2 [BMI=25-30, N=9], obese group-3 [BMI=30-35, N=8], obese group-4 [BMI=36-40, N=9]; obese group-5 [BMI=40-45, N=6], and T2D group-6 [BMI=23-44, N=5]. Relative values are mean ± SEM. Asterisk indicates: *, P<0.05 (ANOVA) versus lean control value. Representative blots are shown in Fig 4.

