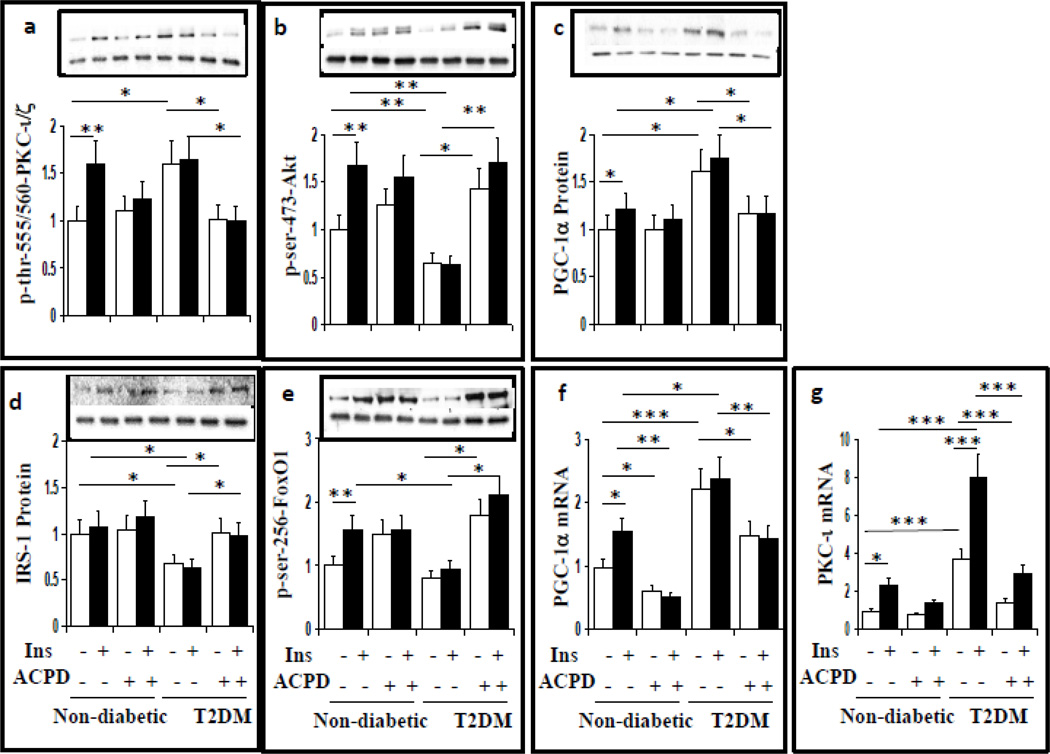
Figure 6.
Effects of aPKC inhibitor, ACPD, on phosphorylation/activation of aPKC (a) and Akt (b), PGC-1α protein levels (c), IRS-1 protein levels, (d), phosphorylation of FoxO1, (e) PGC-1α mRNA levels (f) and PKC-ι mRNA levels (g) in hepatocytes of lean control and T2D humans. Hepatocytes were incubated 24 hours ± 1µM insulin (Ins) ± 1µM ACPD, as described (17, 27) [note that, as reported (17) 1µM insulin was needed to maintain full activation of aPKC and Akt over the course of a 24-hour incubation]. Relative values are mean±SEM of 4 patients. Asterisks indicate P<0.05 (ANOVA). Representative blots of phosphoproteins are shown in upper bands, and loading controls in lower bands.

