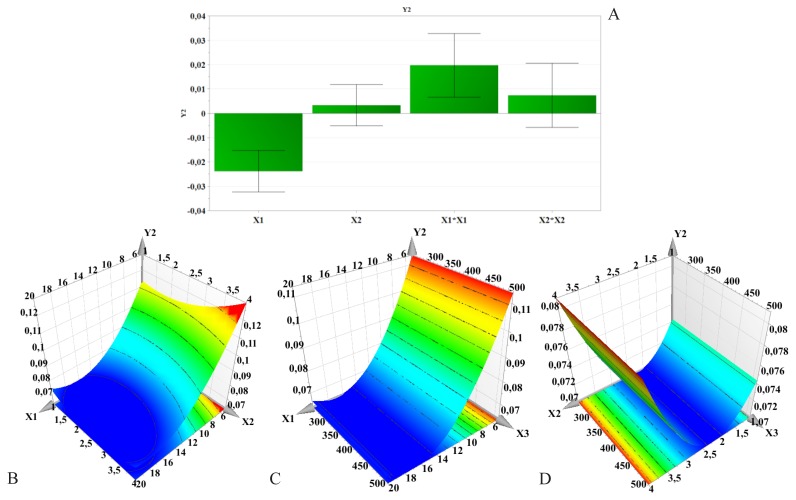
Figure 3.
Regression coefficients (A) and three-dimensional response surface plots showing the effect of formulation factors on PdI (Y2): B – PLGA concentration and PVA concentration effect; C – PLGA concentration and stirring speed effect; D – PVA concentration and stirring speed effect; X1 – PLGA concentration; X2 – PVA concentration; X3 – Stirring speed.

