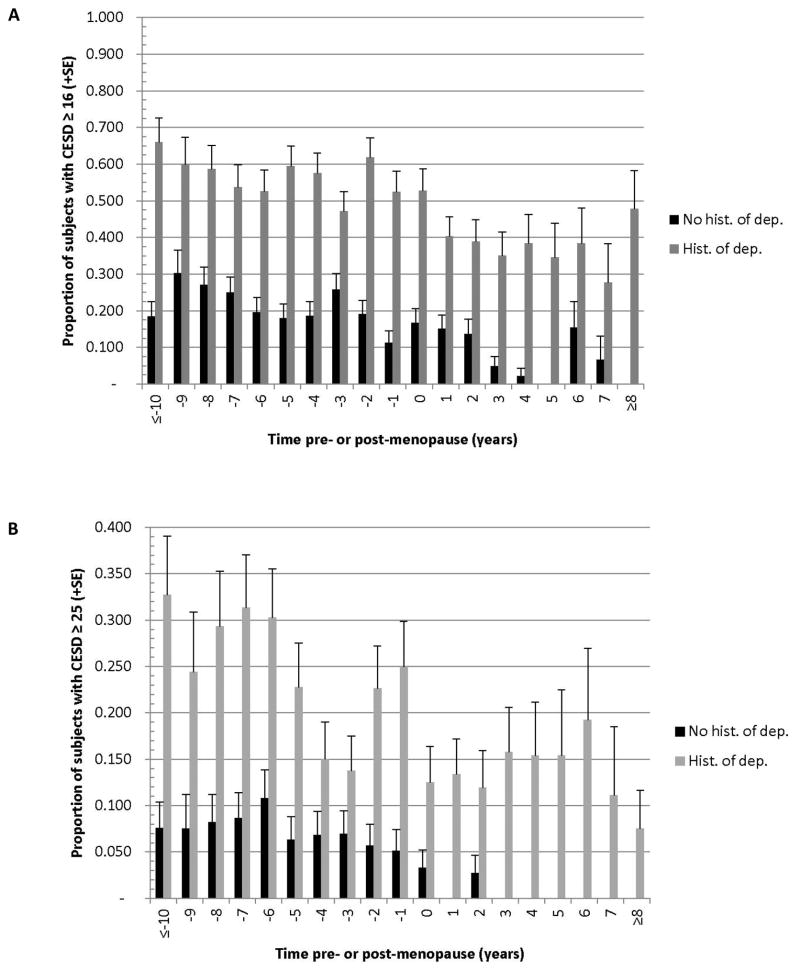
Figure 1.
Proportion of women with CES-D ≥16 (A) or ≥25 (B) in each study year by history of depression at study enrollment. History of depression, N=90; no history of depression, N=113. Years at the range ends were combined due to small numbers of observations; the full range is 12 years before to 11 years after the FMP Results were generated from a multivariable generalized linear mixed model with robust variance (GEE model). Comparisons between the 2 groups each year are P<0.001.

