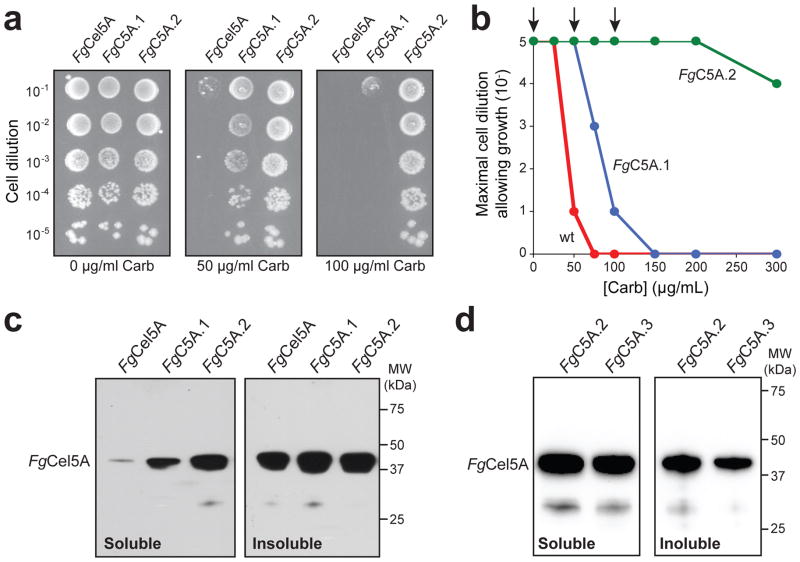
Figure 2. Tat QC-based selection of improved FgCel5A variants.
(a) Representative spot plating of serially diluted E. coli MC4100 cells expressing wt or mutant FgCel5A enzymes from pSALect as indicated. Overnight cultures were normalized to an equivalent number of cells, serially diluted in liquid LB, and plated on LB agar supplemented with varying concentrations of Carb. The spot plates shown are for no selective antibiotic (0 μg/mL Carb) and the concentrations used for the two library selections (50 μg/mL Carb and 100 μg/mL Carb). FgC5A.1 was selected from the first round library while FgC5A.2 was selected from the second round library. (b) Kill curves for wt FgCel5A (red circle), FgC5A.1 (blue circle) and FgC5A.2 (green circle). Plotted data represents the lowest cell dilution that allows for detectable growth at each concentration of Carb. Arrows indicate data that corresponds to the spot plates in (a). (c) Western blot analysis of soluble and insoluble fractions derived from BL21(DE3) cells expressing the wt FgCel5A and isolated mutants from pET28a as indicated. Enzymes were produced in the cytoplasm without the Tat export signal or Bla reporter. Each lane corresponding to the soluble fraction was loaded with 3 μg total protein while the insoluble lanes contained 1 μg total protein. Detection of wt and mutant FgCel5A enzymes was performed using an anti-FLAG antibody. (d) Same as (c) except fractions were derived from BL21(DE3) cells expressing the wt FgCel5A and site-directed FgC5A.3 mutant from pET28a as indicated.

