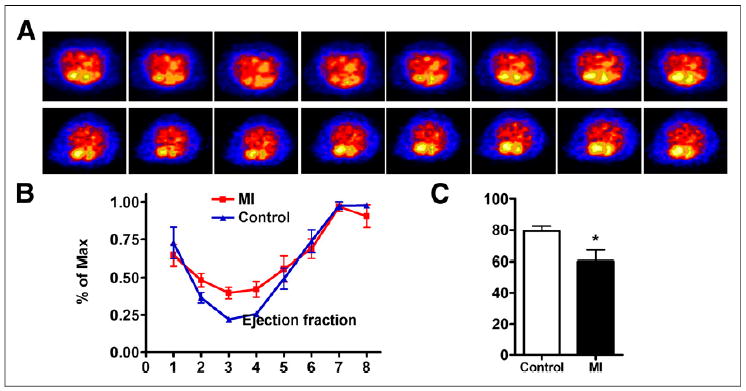
FIGURE 3.

(A) ECG-gated blood-pool imaging of control and MI mice. Transaxial images were reconstructed to display 8 intervals of 1 cardiac cycle. (B) Left ventricular volume curve calculated from PET. (C) Left ventricular ejection fraction calculated from ECG-gated PET. Max = maximum. *P < 0.05.
