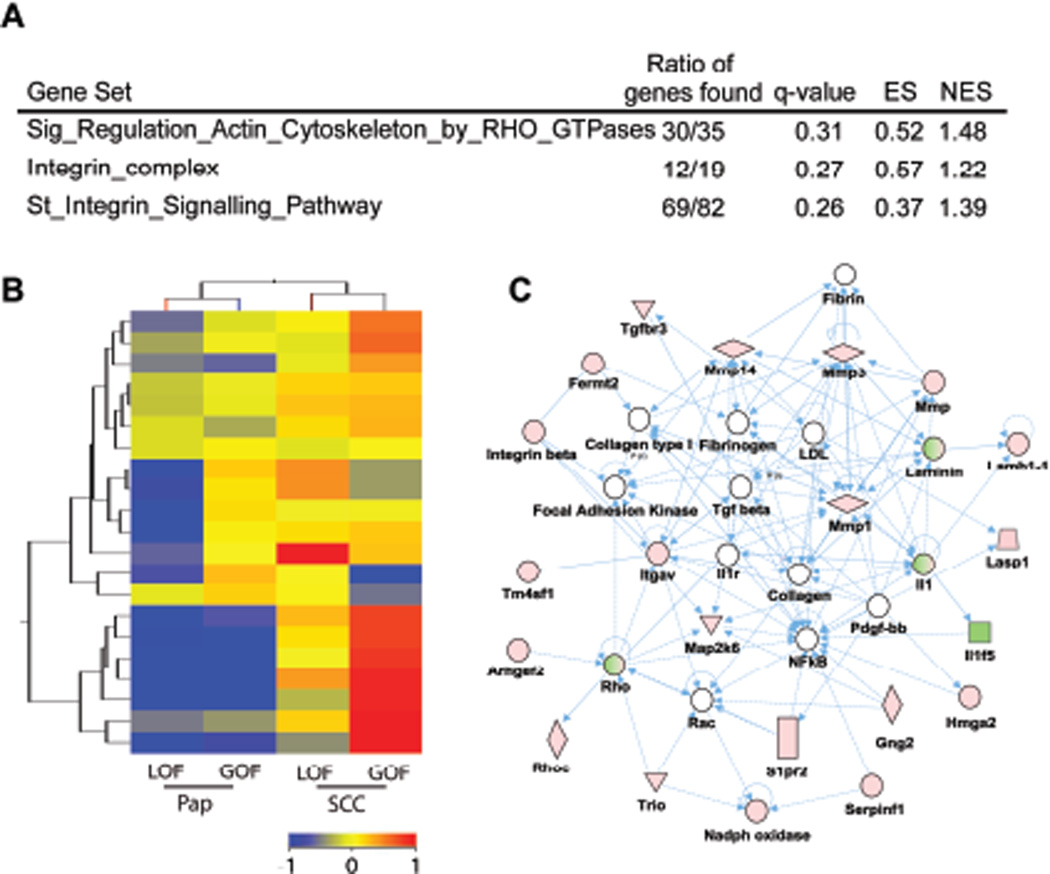
Figure 2.
Integrin and Rho Signaling are enhanced in GOF p53 tumors. (A) GSEA comparing GOF vs. LOF p53 SCCs showed a positive correlation with integrin and Rho GTPases signaling associated genesets (n=10). (B) Clustering of integrin complex genes comparing GOF vs. LOF p53 tumors (n=17). Color bar represent normalized signal intensity. (C) Gene network involving ECM, integrin, and Rho/Rac signaling in GOF p53 tumors. Genes observed to be deregulated in both GOF p53 papillomas and SCCs (Supplementary Dataset 10) (n=10) were analyzed using Ingenuity gene network algorithm. One top rated network is shown for genes that interact (compiled from published literature). Green and red symbols represent downregulated and upregulated genes, respectively. Empty nodes depict genes that are not present in the dataset, but implied from literature. Solid and hatched lines correspond to direct and indirect interactions, respectively.

