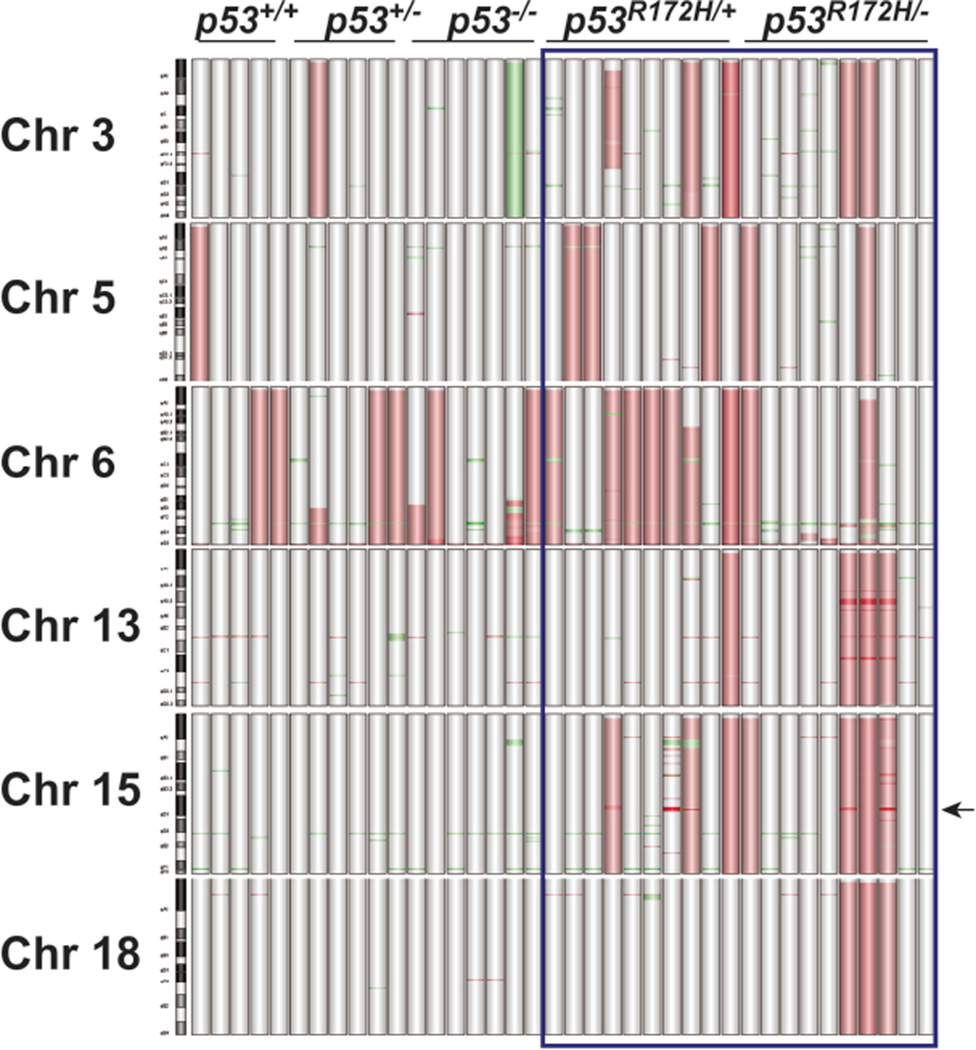
Figure 4.
Distribution of genomic alterations in LOF and GOF p53 SCCs. Graphical representation of the most commonly altered chromosomes in tumors (n=38) was generated using Agilent CGH Analytics software. Vertical bars represent individual tumors. Probes detecting gains or deletions are highlighted as red or green regions, respectively. Arrow represents the location of the Myc locus on chr 15qD1.

