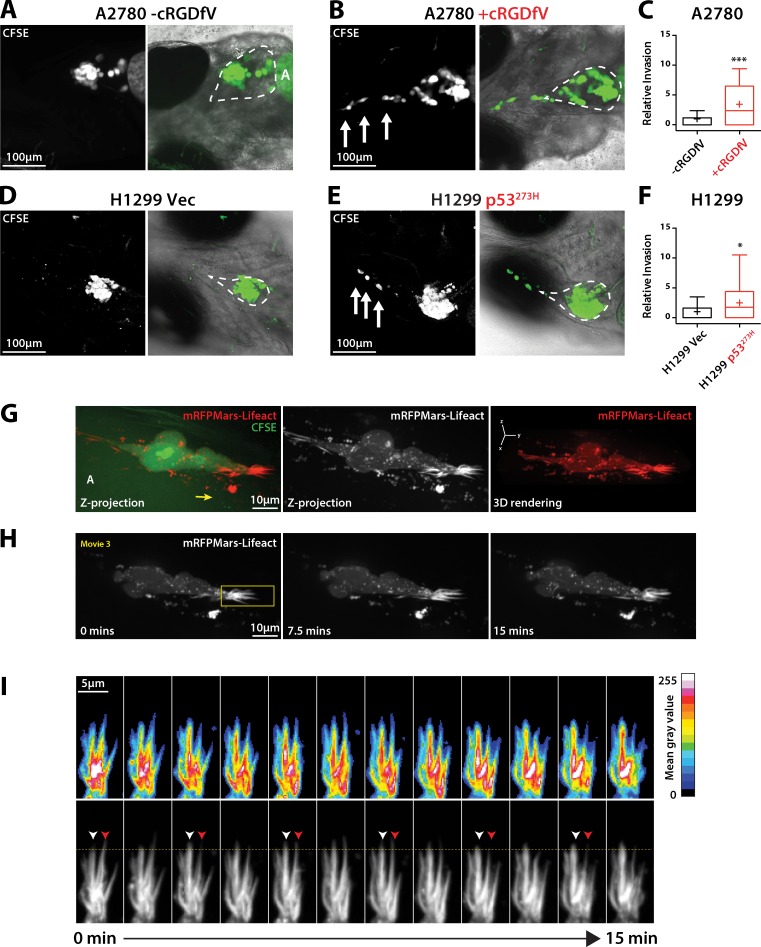
Figure 2.
Dynamic actin spikes form protrusions in cells invading locally in vivo. (A, B, D, and E) CFSE-labeled A2780 cells (A and B) or H1299 cells (D and E) were injected into the pericardial cavity of zebrafish embryos. cRGDfV (2.5 µM) was added 1 dpi as appropriate. Embryos were imaged at 4 dpi to determine invasion. Broken lines indicate the pericardial cavity. A, autofluorescence from the yolk sac. White arrows indicate invading cells. (C and F) Quantification of relative invasion. n = 28–33 fish per condition. (G) CFSE-labeled A2780 cells stably expressing Lifeact-mRFPmars were injected into zebrafish embryos as in A and B, and treated with cRGDfV (2.5 µM). Imaging was performed 3 dpi using a spinning disk confocal microscope. Images represent z projections and 3D rendering. The yellow arrow indicates the direction of migration. (H) Time lapse of Lifeact-mRFPmars–expressing cells over limited z range (2.5 µm). (I) Kymograph of protrusive area highlighted in H (yellow box). White arrowheads indicate an actin spike actively protruding; red arrowheads indicate retraction. The yellow horizontal line provides a reference for protrusion/retraction events. Mean gray value indicates intensity of Lifeact fluorescence. All data represent at least three independent experiments; statistical significance was evaluated using a Student’s t test with Welch’s correction. +, mean; *, P < 0.05; ***, P < 0.001.

