Figure 3.
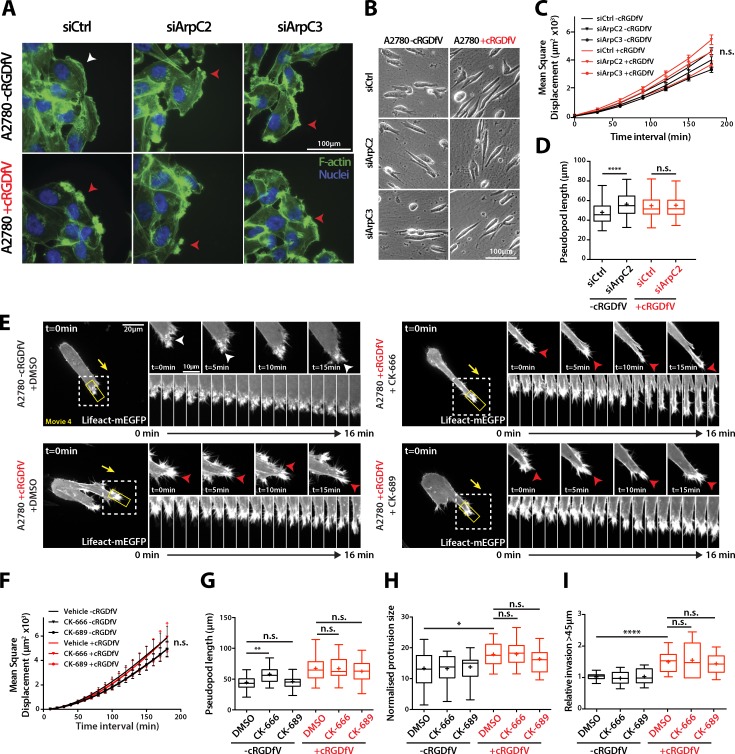
RCP–α5β1-driven migration and invasion is Arp2/3-independent. (A) siControl, ArpC2 knockdown, or ArpC3 knockdown A2780 cells were seeded onto glass coverslips, wounded after 24 h, and treated with cRGDfV (2.5 µM) as indicated before fixation. F-actin was stained with FITC-phalloidin and nuclei with DAPI. The white arrowhead indicates lamellipodia; red arrowheads indicate nonlamellipodial ruffling protrusions. (B) siControl, ArpC2 knockdown, or ArpC3 knockdown A2780 cells were seeded onto 3D CDM for 4 h and treated with cRGDfV (2.5 µM) where indicated before time-lapse imaging. (C) MSD measurement of siCtrl, siArpC2, and siArpC3 A2780 cells migrating in CDM. n ≥ 99 cells per condition. (D) Pseudopod length of siCtrl and siArpC2 A2780 cells migrating in CDM. n = 100 cells per condition. (E) A2780 cells transiently transfected with Lifeact-mEGFP were seeded onto 3D CDM for 4 h, and treated with cRGDfV (2.5 µM, >2 h) and the indicated inhibitors (50 µM) or vehicle control immediately before imaging. Maximum z projections are shown. White arrowheads indicate lamellipodia; red arrowheads indicate ruffling actin spikes. The white boxed regions are enlarged on the right, and the kymograph images are taken from the yellow boxed regions. Yellow arrows indicate the direction of migration. (F and G) MSD (F; n = 20) and pseudopod length (G; n = 50) of DMSO, CK-666, and CK-689–treated A2780 cells migrating in CDM. (H) Normalized protrusion size of A2780 cells expressing Lifeact-mEGFP treated with the indicated inhibitor (50 µM) as in E. n = 13–21 cells per condition with n ≥ 25 frames quantified per cell. (I) A2780 cells were seeded into an inverted invasion assay in the presence of cRGDfV (2.5 µM) where indicated for 72 h. DMSO, CK-666 (50 µM), and CK-689 (50 µM) were added 24 h after seeding and imaged 48 h later to quantify invasion. All data represent at least three independent experiments. Statistical significance was evaluated using ANOVA/Tukey’s multiple comparison test. +, mean; n.s., not significant; *, P < 0.05; **, P < 0.01; ****, P < 0.0001. Error bars represent the SEM.

