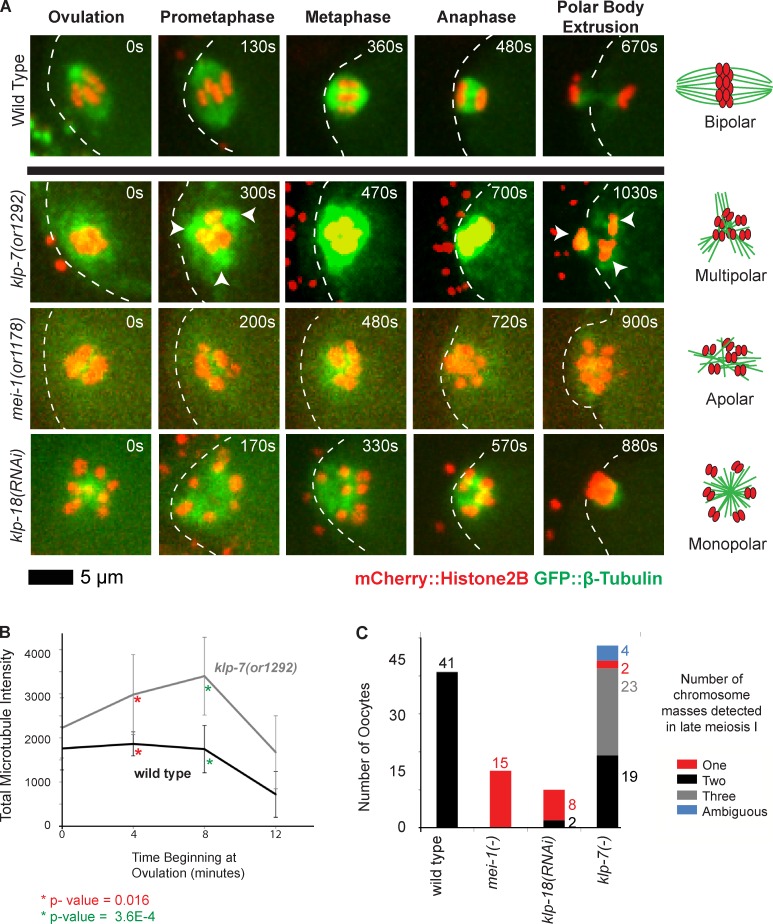
Figure 2.
klp-7(−) mutants accumulate an excess of microtubules and exhibit tripolar chromosome segregation during oocyte meiosis I. (A) Time-lapse spinning disk confocal images during meiosis I in live wild-type and mutant embryos expressing mCherry::Histone H2B and GFP::β-tubulin translational fusions to mark chromosomes and microtubules, respectively. White dashed lines indicate the oocyte plasma membrane, and times after ovulation are indicated in time-lapse sequence frames. Arrowheads indicate possible poles in the klp-7(or1292ts) mutant. Schematics to the right illustrate our interpretations of the pole phenotypes. (B) Integrated GFP::β-tubulin pixel intensity, in arbitrary units, was measured beginning at ovulation and at 4-min intervals (Materials and methods section Microscopy); data are from video recordings of embryos each isolated from individual worms. For wild type, n = 8 and for klp-7(or1292ts), n = 10, at both 4 and 8 min, respectively. Error bars depict the standard deviation among embryos at each time point. P-values, calculated using a Student’s t test, comparing the mean integrated pixel intensities in wild-type and klp-7(−) oocytes for 4 and 8 min are indicated with asterisks. (C) Bar graph shows the number of segregating chromosome masses detected during anaphase for the indicated genotypes, with klp-7(−) referring to the summed results from experiments using RNAi (n = 23), or1092ts (n = 7), and or1292ts (n = 18); each embryo was isolated from a different worm. The numbers of embryos scored as having each phenotype are adjacent to each bar. See Fig. S4 for bar graphs showing the results for each klp-7(−) genotype.

