Figure 3.

Usp5 sensitivity of S65 ubiquitin mutant chains
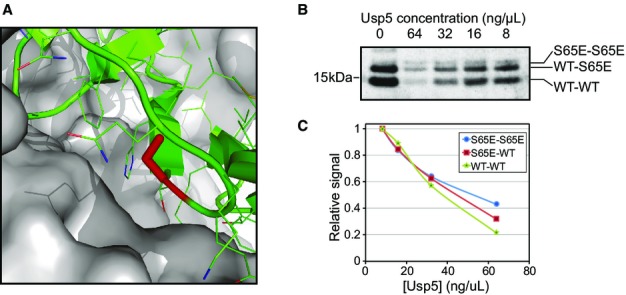
- Structure of ubiquitin in complex with Usp5 (PDB ID: 3IHP). S65 is highlighted in red on the cartoon representation of ubiquitin, while Usp5 surface is shown in gray.
- Anti-ubiquitin immunoblotting of in vitro generated mixed chains comprised of both WT and His-tagged S65E ubiquitin. Chains were subjected to disassembly with various concentrations of Usp5, and the abundance of the dimers was measured.
- Quantification of band signal of the Western blot shown in (B). Y-axis represents signal relative to the point of maximum signal for each series.
