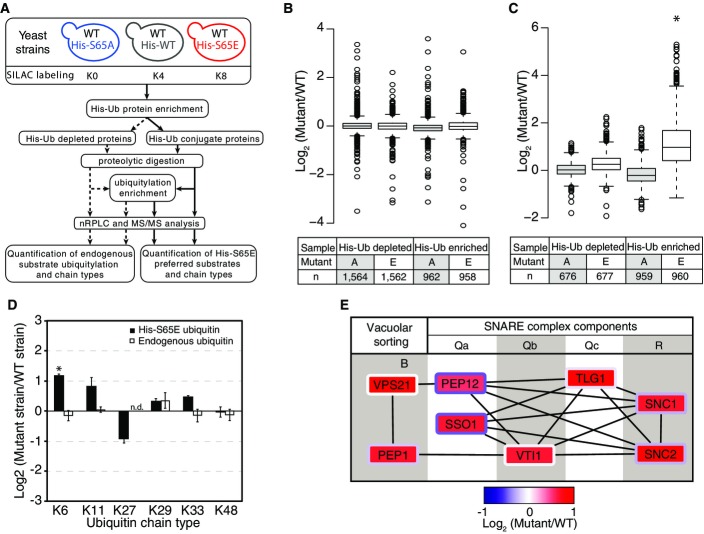
Figure 6.
Targets and effects of S65E ubiquitin
- A A schematic of the experimental design used here.
- B, C Distribution of protein quantification ratios (B) and ubiquitylation site ratios (C) of the different samples analyzed.
- D Log2 quantification of ubiquitin chain abundance in S65E mutant strain relative to WT. Both the endogenous ubiquitin and plasmid-based His-tagged ubiquitin were compared between the S65E and WT strains. Quantification was normalized for total ubiquitin protein expression.
- E Protein–protein interactions between SNARE proteins and vacuolar sorting proteins enriched in S65E ubiquitin-associated proteins. The log2 (S65E/WT) ratio is represented in the box interior, while the log2 (S65A/WT) ratio is represented in the border color of each protein box.
Data information: Box limits in (B, C) indicate the 25th and 75th percentiles as determined by R software; whiskers extend 1.5 times the interquartile range from the 25th and 75th percentiles, outliers are represented by dots. Error bars in (D) indicate the standard deviation of biological duplicate measurements. The statistical significance of the difference between His-tagged and endogenous ubiquitin expression in the S65E or WT strains was assessed using two-sided pairwise t-test, where *P < 0.05. Note, K63 chains could not be quantified due to the presence of the mutated S65 amino acid. Source data are available online for this figure.

