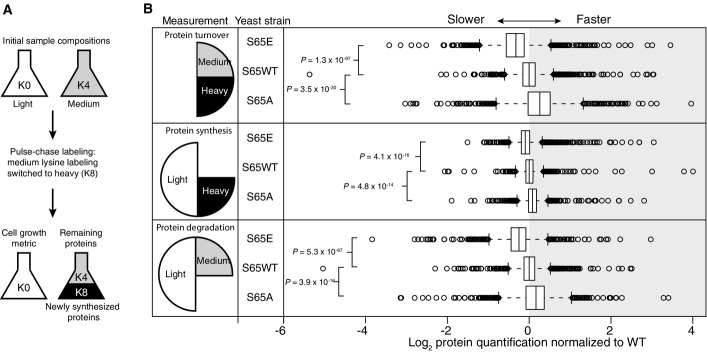
Figure 7.

Analysis of protein synthesis, degradation, and turnover
- The experiment begins with equal populations of light (K0)-labeled and medium (K4)-labeled cells. The light population serves as a control to account for cell growth. Medium-labeled cells are then transferred to media containing heavy lysine (K8). Incorporation of heavy label permits quantification of synthesis, loss of medium label permits quantification of degradation, and the ratio between heavy and medium measures protein turnover.
- Log2 of protein quantification measured for proteome-wide protein turnover (heavy/medium), protein synthesis (heavy/light), and protein degradation (medium/light). Center lines show the median of each distribution (S65E n = 1,765, WT n = 1,666, S65A n = 1,718), and all distributions have been normalized such that the median of the WT sample is centered at zero. Strains with rates slower than WT have median values < 0, while those with faster rates have median values > 0. Box limits indicate the 25th and 75th percentiles as determined by R software; whiskers extend 1.5 times the interquartile range from the 25th and 75th percentiles, outliers are represented by empty circles. P-values displayed are the result of a two-sided t-test assuming unequal variance.
Source data are available online for this figure.
