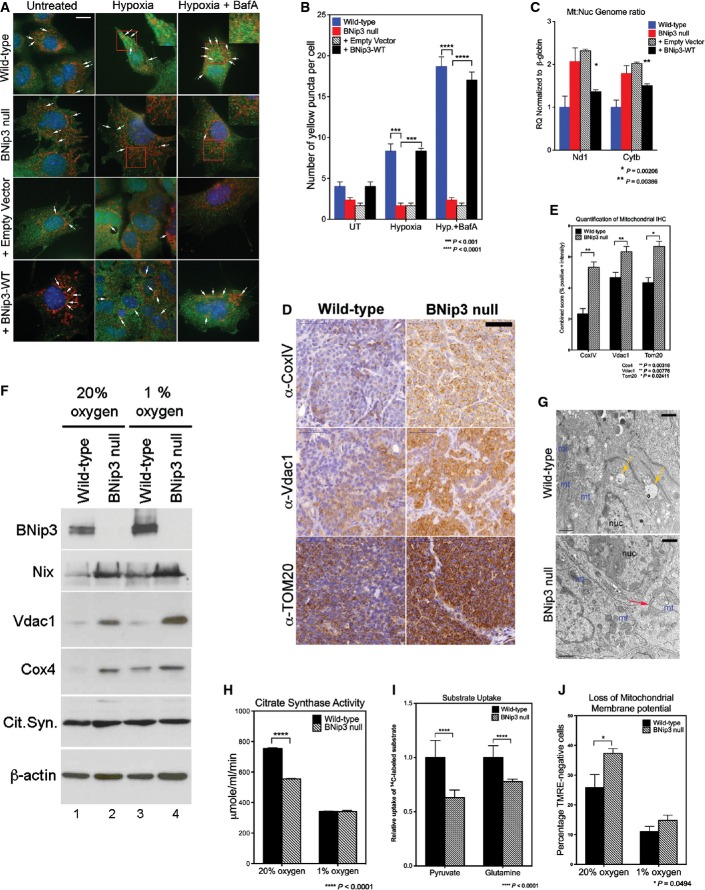
Figure 3.
Loss of BNip3 leads to increased mitochondrial mass but reduced mitochondrial function
- A, B Co-immunofluorescence for endogenous LC3B (green, autophagosomes) and cyclophilin D (red, mitochondria) to examine the levels of mitophagy in wild-type and BNip3 null MECs determined as the number of yellow puncta arising due to overlap of mitochondria and autophagosomes (indicated by white arrows). This was examined at 20% oxygen (untreated), 1% oxygen (hypoxia) and 1% oxygen + bafilomycin A1 (hypoxia + BafA) and in BNip3 null MECs expressing either empty vector control or exogenous BNip3. Scale bar is 20 μm. Quantification of number of yellow puncta (B) per 63 × field. n > 4 for all treatments.
- C qPCR for mitochondrial genome-encoded Nd1 and Cytb standardized to nuclear-encoded β-globin in wild-type MECs, BNip3 null MECs, BNip3 null MECs expressing empty vector control or BNip3 null MECs expressing exogenous BNip3-WT for three independent experiments performed in 8 replicates each.
- D, E Immunohistochemical staining for expression of cytochrome c oxidase-IV (CoxIV), voltage-dependent anion channel-1 (Vdac1) and TOM20 on sections from wild-type (n = 4) and BNip3 null (n = 4) tumors at d65 and quantified (E) using the Aperio system. Scale bar is 50 μm.
- F Western blot analysis for expression of mitochondrial proteins in extracts from wild-type and BNip3 null MECs grown at 20% and 1% oxygen.
- G Transmission electron micrographs of wild-type and BNip3 null primary tumors at d35 illustrating increased mitochondrial density (mt) in BNip3 null tumors compared to wild-type, altered structure (red arrow) and the presence of vesicles in wild-type tumors (yellow arrows). Scale bar is 1 μm.
- H Citrate synthase activity assay as a measure of mitochondrial function on wild-type and BNip3 null MECs grown at 20% and 1% oxygen, measured in triplicate experiments.
- I Measurement of uptake of 14C-labeled pyruvate or glutamine by wild-type and BNip3 null MECs, measured in triplicate experiments.
- J Flow cytometric analysis of TMRE staining as a measure of mitochondrial membrane potential in wild-type and BNip3 null MECs grown at 20% and 1% oxygen, measured in triplicate experiments.
Data information: Results are expressed as the mean ± SEM. *P < 0.05, **P < 0.01, ***P < 0.001, ****P < 0.0001.

