
Figure 4.
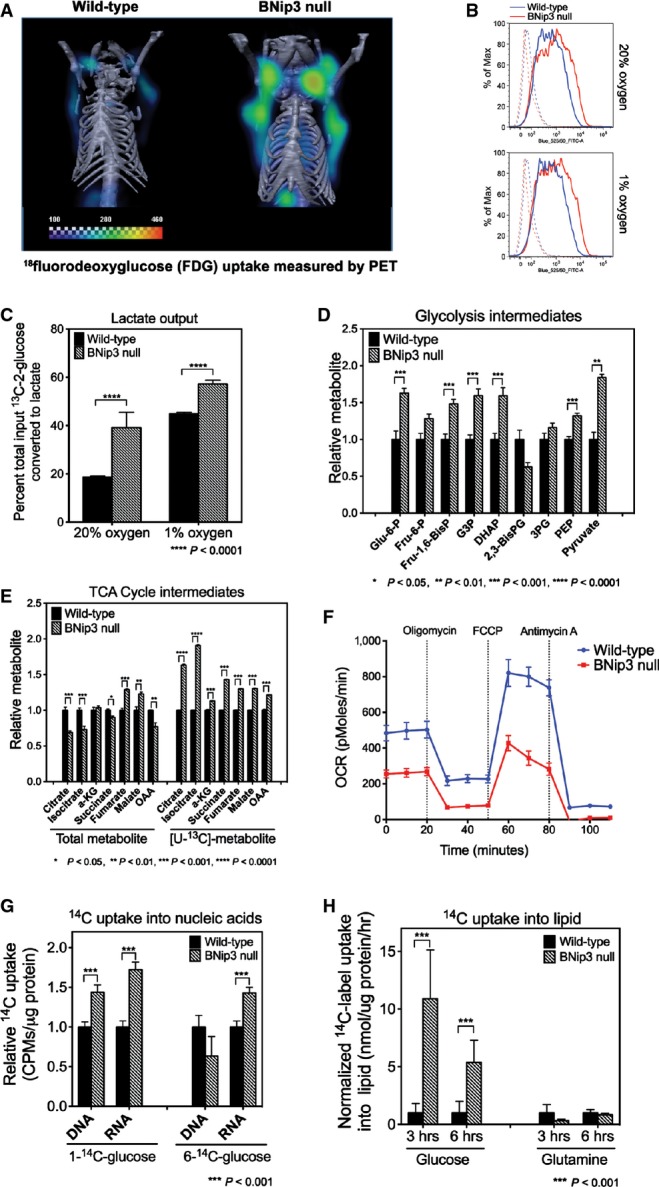
Loss of BNip3 induces aerobic glycolysis and suppresses oxidative phosphorylation
- μPET/CT imaging of wild-type (n = 5) and BNip3 null (n = 5) mice at d50 following injection of mice with 18F-deoxyglucose to examine glucose uptake by tumors.
- Flow cytometric measurement of fluorescent glucose uptake by wild-type and BNip3 null MECs grown in vitro at 20% and 1% oxygen.
- Lactate output by wild-type and BNip3 null MECs grown at 20% and 1% oxygen was measured by NMR, performed in triplicate.
- Mass spectrometric measurement of total levels of glycolytic intermediates (n = 4 for each genotype).
- Mass spectrometric measurement of total levels of TCA cycle intermediates and of 13C-labeled intermediates after growth in [U13C]-glucose for 6 h (3 biological replicates and 3 experimental replicates).
- Oxygen consumption using Seahorse XF96 by wild-type (blue) and BNip3 null (red) MECs (6 experimental replicates per point), performed in triplicate experiments.
- Measurement of uptake of 14C-labeled glucose into nucleic acids in wild-type and BNip3 null MECs (performed twice in triplicate).
- Measurement of uptake of 14C-labeled glucose or glutamine into lipid in wild-type and BNip3 null MECs (performed twice in triplicate).
Data information: Results are expressed as the mean ± SEM. *P < 0.05, **P < 0.01, ***P < 0.001, ****P < 0.0001.