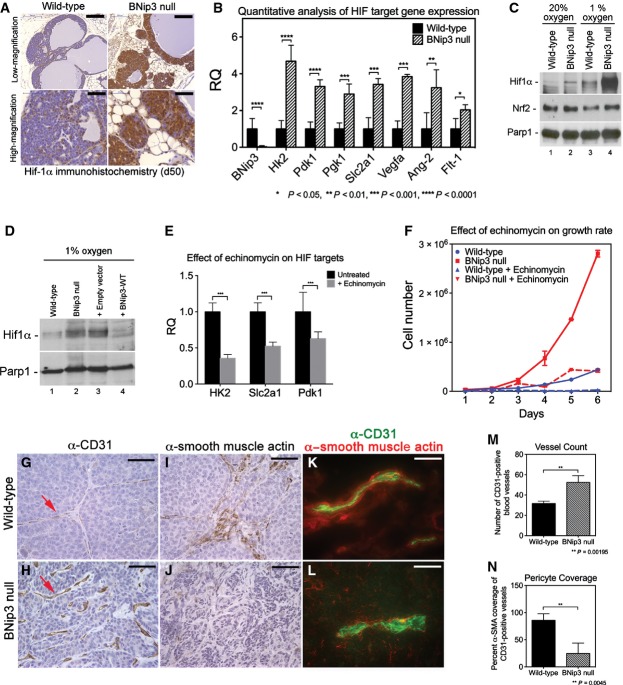
Figure 5.
Loss of BNip3 promotes increased Hif-1α activity
- A Immunohistochemical staining for Hif-1α in wild-type (n = 4) and BNip3 null (n = 4) tumors at d50. Scale bar at low magnification is 200 μm. Scale bar at high magnification is 50 μm.
- B qPCR for expression of key Hif target genes and other growth-related genes in tumors from wild-type and BNip3 null mice at d80 (n = 2 per genotype, performed in triplicate).
- C Western blot for Hif-1α, Nrf-2 and Parp-1 on nuclear extracts from wild-type and BNip3 null MECs grown at 20% or 1% oxygen.
- D Western blot for Hif-1α and Parp-1 on nuclear extracts from wild-type and BNip3 null MECs (lanes 1, 2), and on parental BNip3 null MECs expressing either empty control vector (+ Empty vector, lane 3) or BNip3-expressing vector (+ BNip3-WT, lane 4), all cultured at 1% oxygen.
- E qPCR for key HIF target genes in BNip3 null MECs before and after treatment with 10 ng/ml echinomycin.
- F Growth rate of primary wild-type (blue) and BNip3 null (red) MECs treated with 10 ng/ml echinomycin, measured in triplicate experiments.
- G, H Immunohistochemical staining for CD31 on wild-type (n = 20) and BNip3 null (n = 20) tumors at d80. Scale bar is 25 μm.
- I, J Immunohistochemical staining for α-SMA on wild-type (n = 20) and BNip3 null (n = 20) tumors at d80. Scale bar is 25 μm.
- K, L Co-staining for CD31 and α-SMA on frozen sections of wild-type (n = 8) and BNip3 null (n = 8) tumors at d80. Scale bar is 10 μm.
- M, N Quantification of vessel count (M) and pericyte coverage (N) in wild-type and BNip3 null tumors at d80.
Data information: Results are expressed as the mean ± SEM. *P < 0.05, **P < 0.01, ***P < 0.001, ****P < 0.0001.

