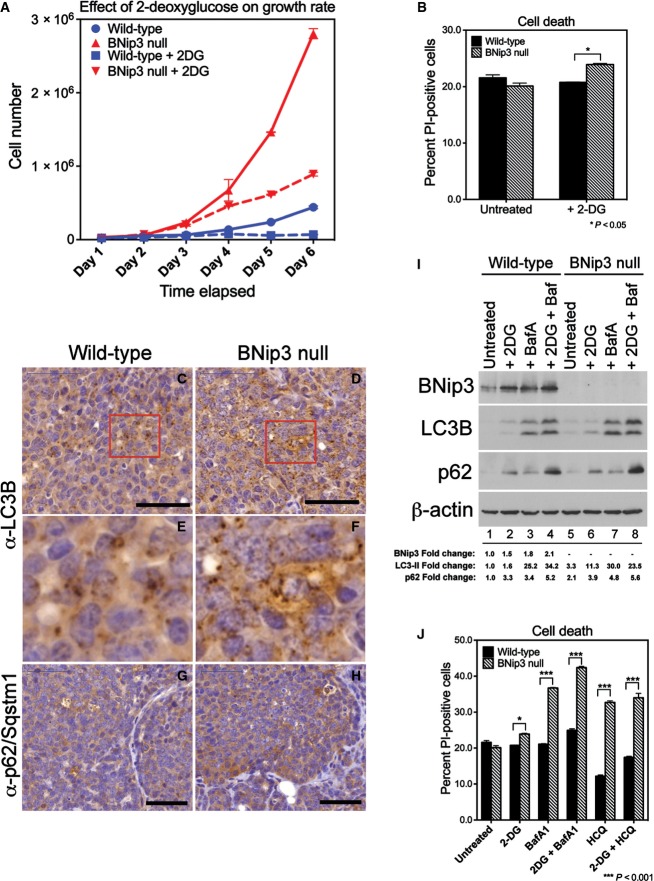
Figure 7.
Loss of BNip3 induces increased dependence on autophagy for survival
- A Effect of inhibiting glycolysis with 2-deoxyglucose for the growth rate of wild-type and BNip3 null MECs grown at 20% oxygen (performed in triplicate).
- B Measurement of cell death measured by flow cytometric quantification of propidium iodide uptake in the presence or absence of 2-deoxyglucose.
- C–H Immunohistochemical staining for LC3B (C–F) and p62/sqstm1 (G, H) on sections of wild-type (C, E, G; n = 4) and BNip3 null (D, F, H; n = 4) tumors at d80. Black scale bar is 50 μm. Red cut-out box in (C) and (D) is presented in (E) and (F), respectively.
- I Western blot analysis of levels of BNip3, processed LC3B, p62/Sqstm1 and β-actin (loading control) in the presence or absence of 2-deoxyglucose or bafilomycin A1. Band intensity was calculated using ImageJ and standardized to the intensity of the loading control (β-actin). Fold change was determined relative to wild-type values in lane 1 for each protein measured.
- J Measurement of cell death analyzed by flow cytometric quantification of propidium iodide uptake in the presence or absence of bafilomycin A1, hydroxychloroquine and/or 2-deoxyglucose, performed in duplicate experiments.
Data information: Results are expressed as the mean ± SEM. *P < 0.05, ***P < 0.001.

