
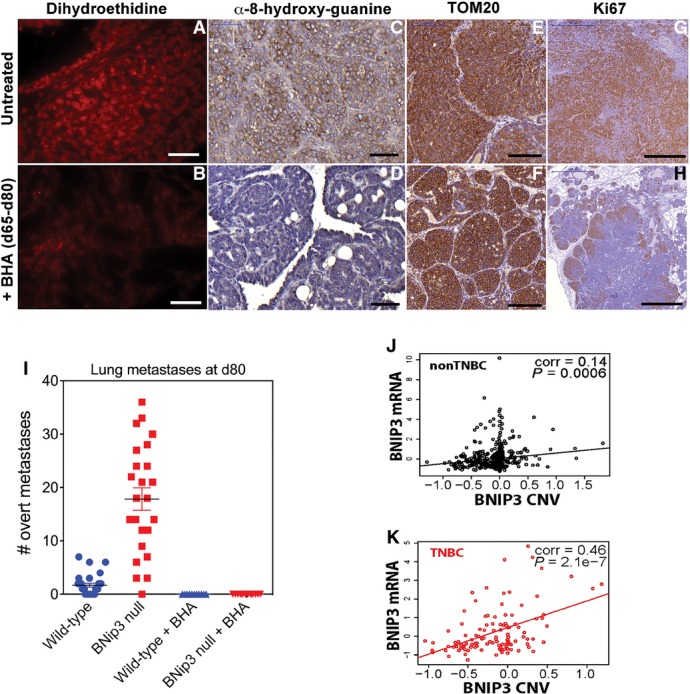
Additional controls and effects of quenching ROS for tumorigenesis
- A, B Staining with dihydroethidine for superoxide levels in situ on BNip3 null tumor sections at d80 following supplementation of mouse diet with BHA (B) or not (A). Scale bars are 50 μm.
- C, D Immunohistochemical staining for 8-hydroxyguanine to assess effects of BHA diet (D) on levels of ROS in tumors from BNip3 null mice compared to untreated BNip3 null mice (C). Scale bars are 50 μm.
- E, F Immunohistochemical staining for TOM20 to assess effects of BHA diet (F) on mitochondrial mass in tumors from BNip3 null mice compared to untreated BNip3 null mice (E). Scale bars are 100 μm.
- G, H Immunohistochemical staining for Ki67 to assess the effects of BHA diet (H) on tumor cell proliferation in tumors from BNip3 null mice compared to untreated BNip3 null mice (G). Scale bars are 500 μm.
- I Metastasis numbers in serial sections of lungs from wild-type or BNip3 null mice sacrificed at d80 either untreated or treated with BHA diet from d65–d80. Wild-type/UT, n = 21; BNip3 null/UT, n = 24; Wild-type/BHA, n = 11; BNip3 null/BHA, n = 14.
- J RNAseq-derived mRNA expression levels of BNip3 correlated with chromosomal copy number variation of BNip3 in non-TNBC samples of TCGA breast cancer cohort (n = 576).
- K RNAseq-derived mRNA expression levels of BNip3 in TNBC correlated with chromosomal copy number variation of BNip3 in TNBC samples of the TCGA breast cancer cohort (n = 113).