
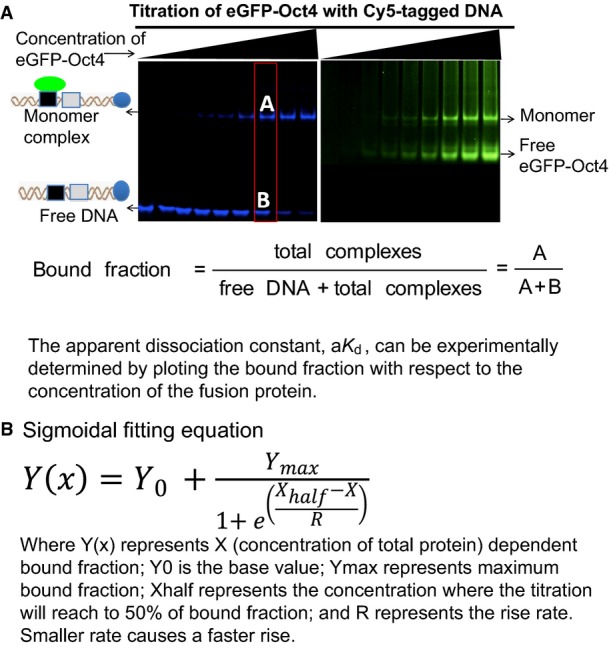
Quantification of aK d by FP-EMSA
- Blue panel: DNA; green panel: protein detection. For quantification purpose, only the blue panel needs to be taken into consideration. The bound fraction was calculated according to the equation provided.
- Sigmoid fitting function used to fit the bound fraction versus total protein concentration plot.
Source data are available online for this figure.