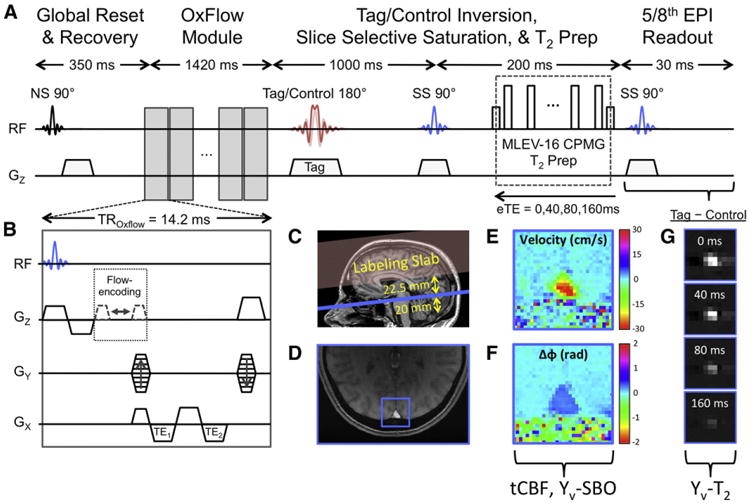
Fig. 1.

iTRUST pulse sequence and example images. (A) TRUST sequence diagram with (B) inset depicting the OxFlow module inserted within the T1 recovery period of the TRUST sequence. (C) Sagittal scout image indicating the relative positions of the labeling slab (red) and imaging slice (blue). (D) Magnitude image with square region of interest indicating the position of the SSS. (E) Velocity map and (F) phase difference map of the SSS ROI from (D). (G) TRUST difference images for each eTE. Note that the spin histories of the OxFlow module and TRUST sequence should not interact as they are isolated by the global spin reset and the spatial separation of the imaging slice and labeling slab.
