
Fig. 3.
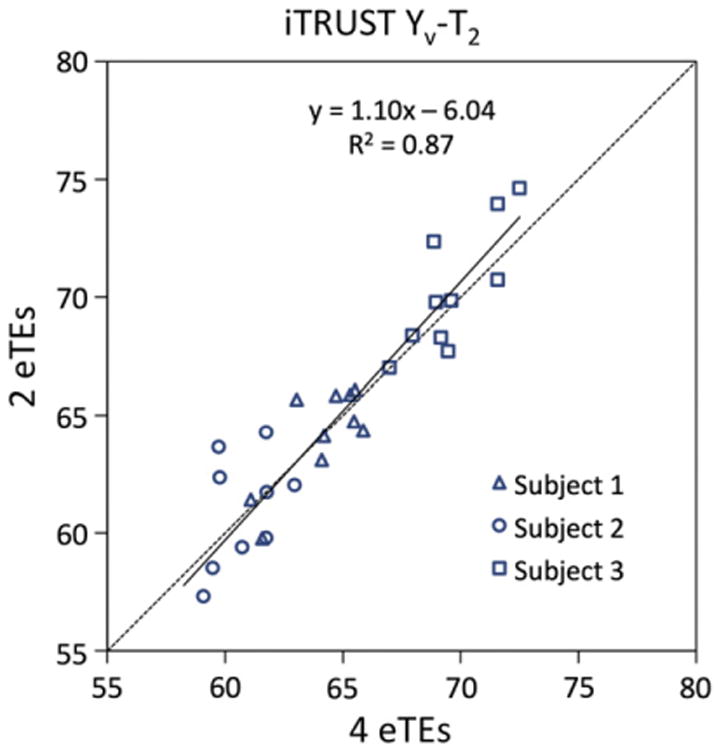
Scatter plot of iTRUST Yv-T2 values fitted using all four (0, 40, 80, and 160 ms) vs. only two (0 and 80 ms) eTEs from the same data. The 30 data points represent 10 repeat measures from each of three subjects. The linear least-squares regression line for all data points (solid line) is shown along side the line of identity (dotted line). 95% confidence intervals for the slope [0.93, 1.25] and intercept [− 16.4, 4.3] of the linear fit contain 1 and 0, respectively, indicating no statistically significant bias between the four and two eTE Yv-T2 values.