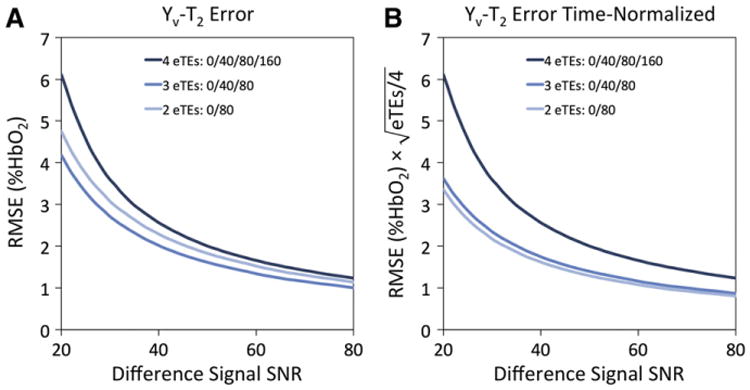
Fig. 4.

Simulation of expected Yv-T2 error vs. the number of eTEs used for T2 fitting. (A) Root-mean-square error (RMSE) in Yv-T2 vs. TRUST difference signal SNR for four, three, or two eTEs. (B) RMSE normalized to acquisition time. Simulations were performed for N = 1000 virtual images for each SNR value, incremented by an SNR value of 1.
