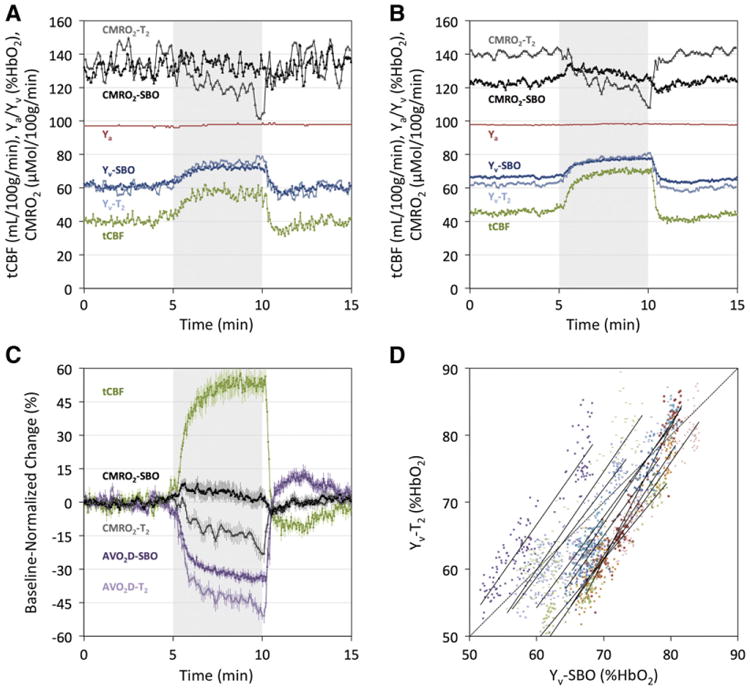
Fig. 7.

iTRUST-derived parameter values inresponse to five minutes of 5% CO2 gas mixture breathing. (A) Time-course plots of absolute parameter values from (A) a representative subject and (B) averaged across all 10 subjects. (C) Subject-averaged parameter values normalized to average baseline values, with error bars indicating standard errors (N=10) at each time point. The arteriovenous oxygen saturation difference (AVO2D) is equal to Ya – Yv. In all time-course plots, tCBF, Ya, Yv-SBO, AVO2D-SBO, and CMRO2-SBO temporal resolution is three seconds, and Yv-T2, AVO2D-i2, and CMRO2-T2 temporal resolution is six seconds. Gray shading indicates the hypercapnia period. (D) Scatter plot of time-matched Yv-SBO and Yv-T2 values across all subjects and time points (N = 1490), with different symbols/colors denoting individual subjects. Linear least-squares regression lines are plotted for each subject (solid lines), as well as the line of identity (dotted line). Mean slope and R2 values of the regression lines across subjects are β = 1.47 ± 0.20 and R2 = 0.90 ± 0.02.
